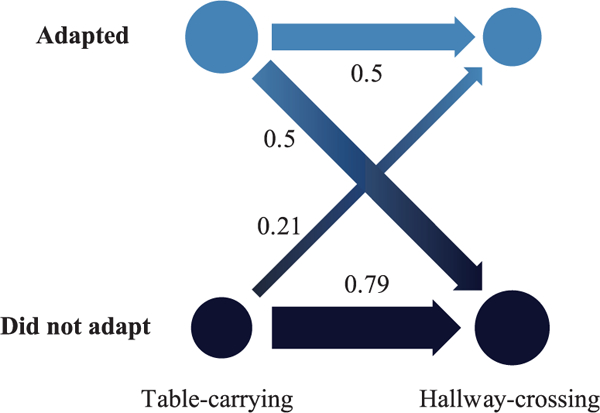
Fig. 13.

Adaptation rate of participants for two consecutive tasks. The lines illustrate transitions, with the numbers indicating transition rates. The thickness of the lines is proportional to the transition rate, whereas the area of the circles is proportional to the number of participants. Whereas 79% of the users that insisted in their strategy in the first task remained non-adaptable in the second task, only 50% of the users that adapted to the robot in the table-carrying task, adapted to the robot in the hallway-crossing task.
