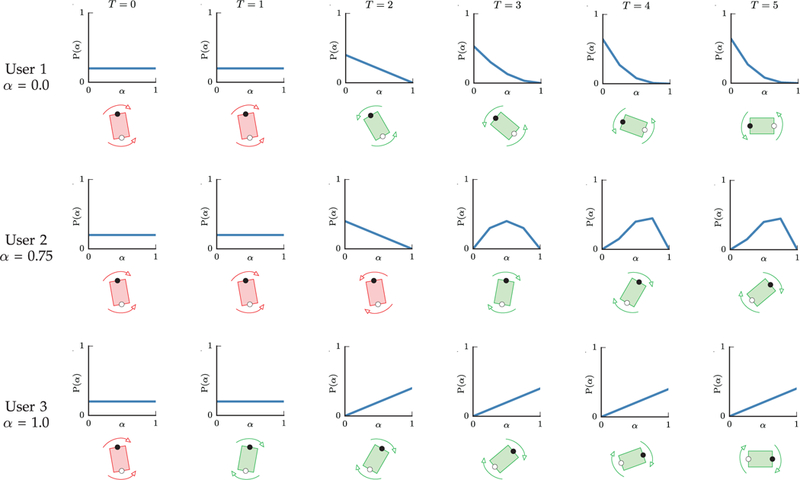
Fig. 2.

Sample runs on the human-robot table-carrying task, with three simulated humans of adaptability level α = 0, 0.75, and 1. A fully adaptable human has α = 1, while a fully non-adaptable human has α = 0. In each case, the upper row shows the probabilistic estimate on α over time. The lower row shows the robot and human actions over time. Red color indicates human (white dot) and robot (black dot) disagreement in their actions, in which case the table does not move. The columns indicate successive time steps. User 1 is non-adaptable, and the robot complies with his preference. Users 2 and 3 are adaptable to different extent. The robot successfully guides them towards a better strategy.
