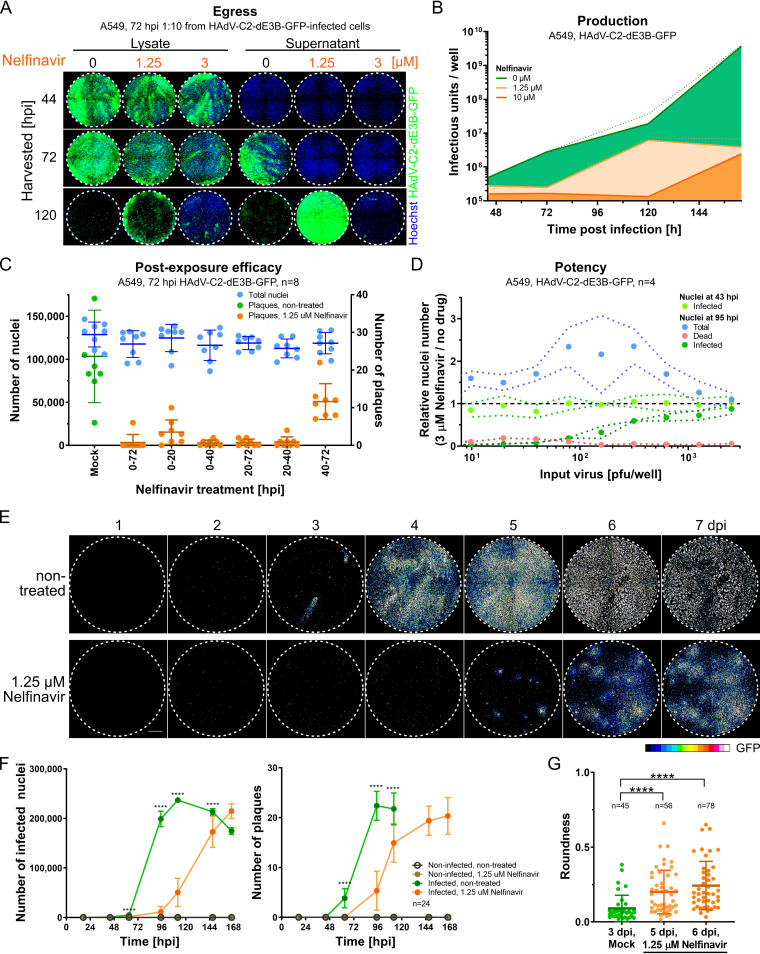
FIG 3.
Nelfinavir is a postexposure inhibitor of HAdV-C egress. (A) A549 cells were imaged at 3 days postinoculation with 1:10-diluted cell lysates (left) or supernatants (right) from nelfinavir-treated or control A549 cells, which had been infected with HAdV-C2-dE3B-GFP for the indicated times (harvested [hpi]). The results show delayed viral progeny release into the supernatant of nelfinavir-treated cells. Nuclei are shown in blue, and infection markers are shown in green (GFP). (B) Released and cell-associated progeny from HAdV-C2-dE3B-GFP-infected A549 cells treated with nelfinavir or DMSO (green), as determined by titration on A549 cells in a 12-well assay format. Lines indicate mean slopes, and dotted lines indicate standard errors. Linear regression of data from three biological triplicates is shown. (C) Time-resolved emergence of plaques in HAdV-C2-dE3B-GFP-infected A549 cells treated with 1.25 μM nelfinavir. Data points represent results from one of eight technical replicates. Colored vertical lines indicate the means, and error bars indicate the standard deviations. (D) The inhibitory effect of nelfinavir on HAdV-C2-dE3B-GFP spread is dependent on the amount of input virus during initial infection. The number of infected GFP-positive cells is shown at 3 μM nelfinavir relative to the mean number of solvent-treated cells infected with the corresponding dosage. Note that the number of infected cells at 43 hpi is not affected by nelfinavir treatment. Data points represent means from four technical replicates. Dotted lines indicate standard deviations. (E) Treatment of HAdV-C2-dE3B-GFP-infected A549 cells with 1.25 μM nelfinavir suppresses comet-shaped plaques and reveals slow-growing quasiround plaques. Viral GFP expression levels are shown as 16-color look-up table (LUT). Bar = 1 mm. (F) Treatment with 1.25 μM nelfinavir inhibits HAdV-C2-dE3B-GFP infection of A549 cells by slowing plaque formation. Data points represent means from 24 technical replicates, including the well shown in the micrographs of panel D. Error bars indicate standard deviations. Statistical significance of drug-treated versus nontreated cells was derived by the Kolmogorov-Smirnov test, with a P value of <0.0001 (****). (G) The delayed HAdV-C2-dE3B-GFP plaques in the presence of 1.25 μM nelfinavir are significantly rounder than control plaques, as indicated by a Kolmogorov-Smirnov test. Data points indicate plaque regions in the well center harboring a single peak region. Shown is a summary of data from 24 technical replicates, including the well shown in the micrographs of panel D. Regions consisting of at least 5 infected cells (≥1,500 μm2) were considered a plaque. Plaque morphologies in control wells could not be quantified later than 3 dpi due to rapid virus dissemination. For plaques from DMSO-treated cells at 3 dpi compared to nelfinavir-treated ones at 5 dpi, the approximate P value was <0.0001 (****). For DMSO-treated plaques at 3 dpi versus nelfinavir-treated plaques at 6 dpi, the approximate P value was <0.0001 (****). Statistical significance was determined by a Kolmogorov-Smirnov test.

