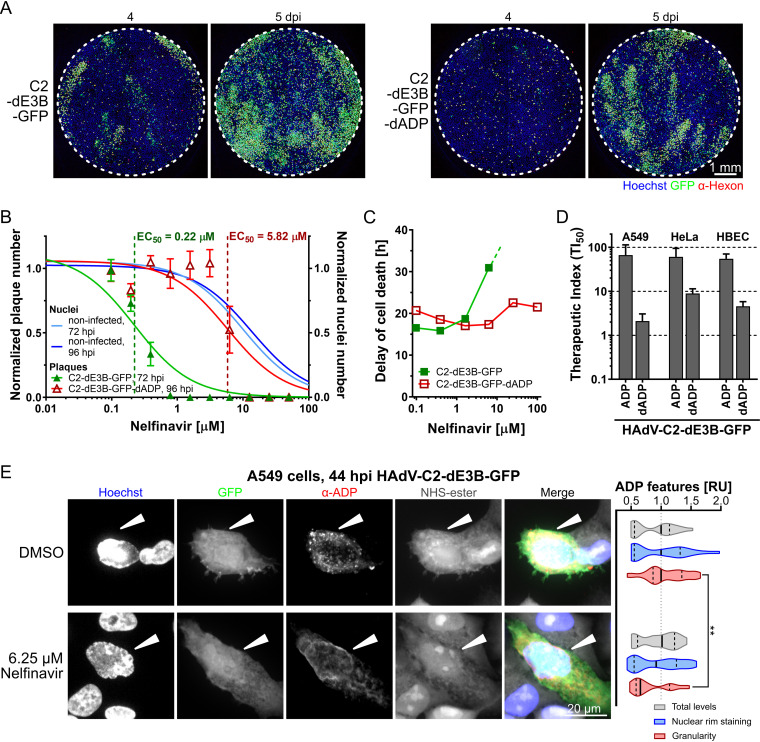
FIG 4.
ADP contributes to the inhibitory effect of nelfinavir against HAdV-C. (A) The deletion of ADP from HAdV-C2-dE3B-GFP delays plaque formation in A549 cells by 1 day but does not change plaque shape. Cells were infected with 1.1 × 10⁵ VP/well. (B) The deletion of ADP from HAdV-C2-dE3B-GFP reduces the antiviral effects of nelfinavir in A549 cells, with an EC50 of 5.82 compared to 0.22 μM for the parental virus. HAdV-C2-dE3B-GFP infection was quantified at 72 hpi, and ADP deletion mutant infection was quantified at 96 hpi. Plaque numbers per well were normalized to the mean DMSO control value. Numbers of nuclei in noninfected, treated wells were normalized to the mean for the DMSO control. Data points represent means from four technical replicates. Error bars indicate standard deviations. EC50 values were derived from nonlinear curve fitting. For detailed information and statistics, see Table S2 in the supplemental material. (C) The delay of dell death was calculated from the highest mean cell index (CI) and its half-maximum for each treatment (means from two technical replicates). For HAdV-C2-dE3B-GFP-infected A549 cells treated with 25 μM nelfinavir, the measurement was aborted due to overgrowth causing cytotoxicity before the maximal cell index was reached. Treatment with 100 μM nelfinavir was toxic. (D) TI50 derived from the ratio of the nelfinavir concentration causing 50% toxicity (TC50) and the concentration leading to a 50% reduction in plaque numbers per well (EC50). Results from different cancer and primary cells are shown for HAdV-C2-dE3B-GFP and HAdV-C2-dE3B-dADP lacking ADP. For detailed information and statistics, see Table S2. (E, left) Representative high-magnification confocal images of HAdV-C2-dE3B-GFP-infected A549 cells at 44 hpi showing the effect of nelfinavir on ADP localization. ADP was stained by immunofluorescence with a rabbit anti-HAdV-C2-ADP87–101 antibody. Cells were stained using NHS-ester. White arrowheads highlight infected cells. Nuclei are in blue. Images are maximal projections of 30 z planes with 0.5-μm z steps. (Right) Relative units (RU) of total ADP expression, localization to the nuclear rim, and granularity normalized to the mean values from DMSO-treated control cells. The data set is comprised of 20 nelfinavir-treated infected cells and 23 control cells. Solid lines indicate medians, and dotted lines indicate the 5 to 95% quantiles. The Kolmogorov-Smirnov test indicated an ADP granularity P value of 0.0019 (**).

