FIG 6.
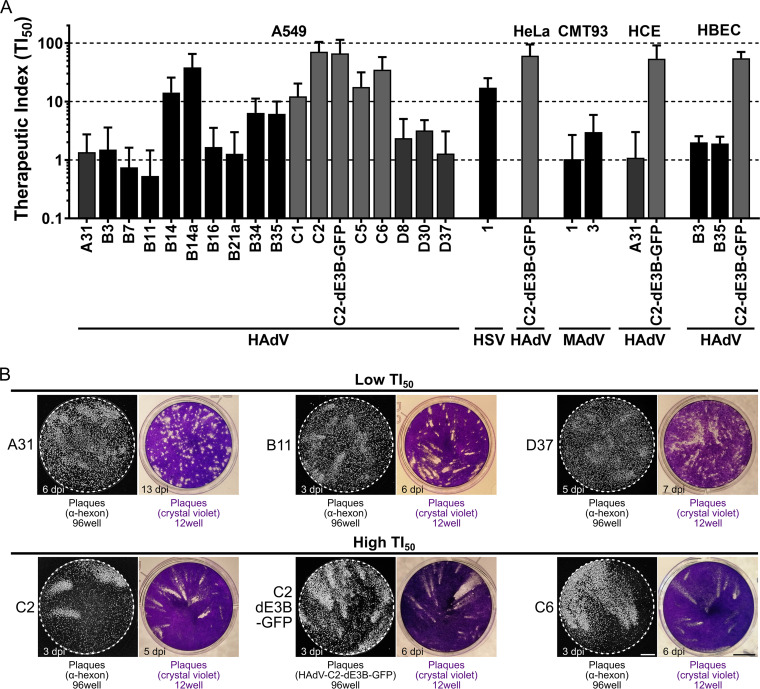
Susceptibility of HAdV to nelfinavir correlates with plaque shape. (A) TI50 calculated from the ratio of the nelfinavir concentration causing 50% toxicity (TC50) and the concentration leading to 50% plaque reduction (EC50). Different HAdVs, mouse adenoviruses (MAdV), and herpes simplex virus 1 (HSV-1) were tested in different cancer and primary cell lines. For detailed information and statistics, see Table S2 in the supplemental material. (B) Representative microscopic and macroscopic plaque morphologies of nelfinavir-sensitive and -insensitive HAdV types. Grayscale images show plaques based on epifluorescence microscopy of hexon immunostaining or GFP expression in A549 cells (96-well format) (bar = 1 mm). Colored images show plaques visualized by crystal violet staining in A549 cells (12-well format) (bar = 5 mm).

