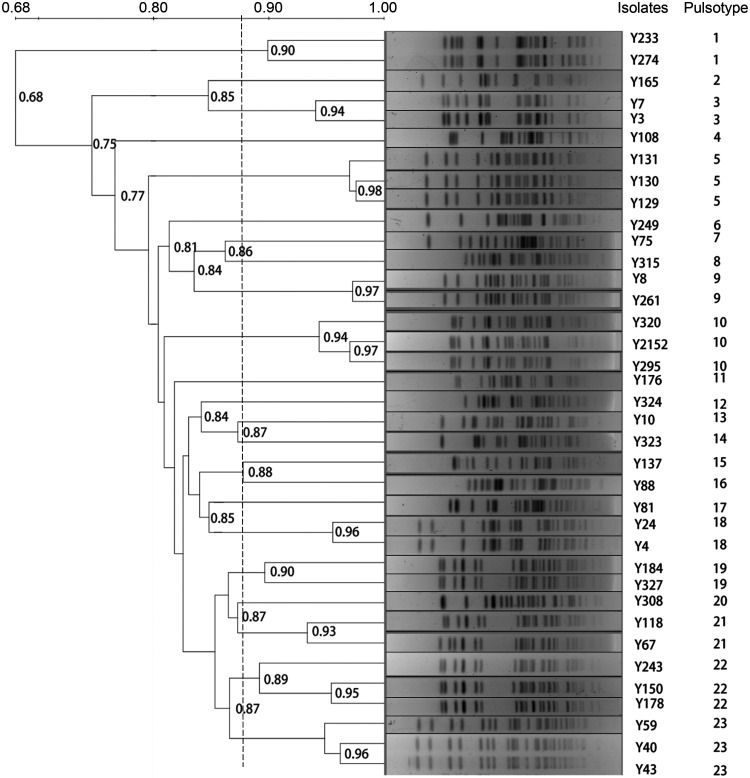
FIG 2.
PFGE patterns of the 37 aac(3)-IIg-positive E. cloacae complex isolates. Genomic DNA from each isolate was digested with XbaI and subsequently subjected to PFGE to generate diagnostic genomic DNA fingerprints. The dendrogram of the PFGE profiles was clustered by UPGMA, and a genetic similarity index scale is shown on the right of the dendrogram. The strain number and PFGE types are included along each PFGE lane.

