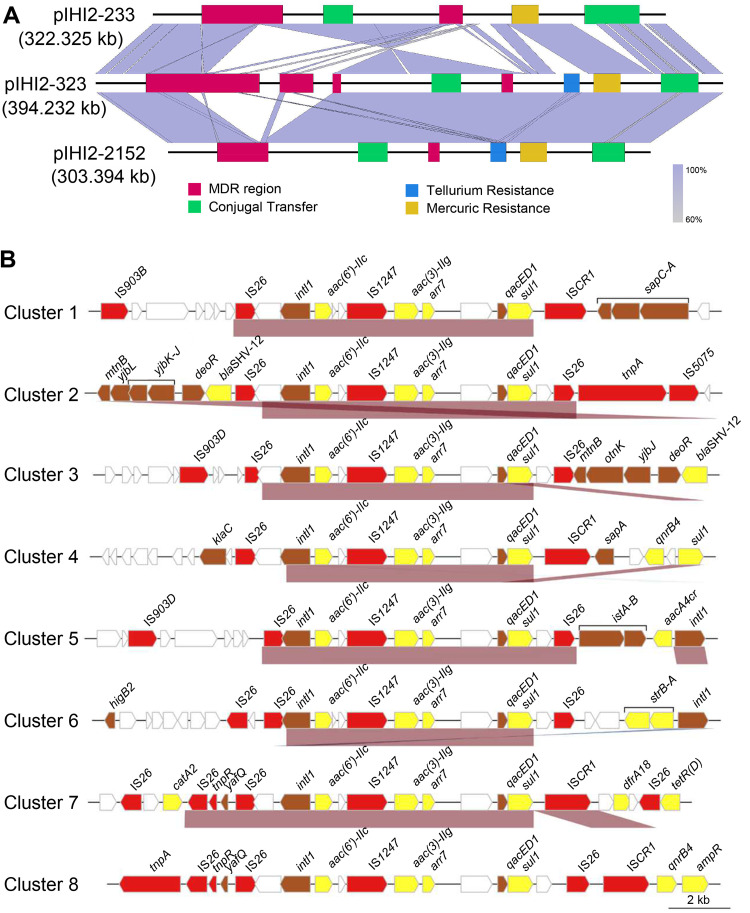
FIG 4.
Comparative genomics analysis of plasmids and the genetic environment of the aac(3)-IIg gene. (A) Comparison of the genome structures of plasmids pIHI2-233 (GenBank accession no. CP049047.1), pIHI2-323 (GenBank accession no. CP049189.1), and pIHI2-2152 (GenBank accession no. CP049193.1). Boxes are colored based on the gene function classification. Orthologous regions are connected and color coded. (B) Structure of the aac(3)-IIg gene-related regions. Eight representative sequences from the eight clusters (one sequence from each cluster) are shown. The arrows represent sequence units or genes and are color coded, with the arrowheads indicating the direction of transcription. The names of the sequence units are indicated above the arrows, with the sequence units of unknown function left blank.

