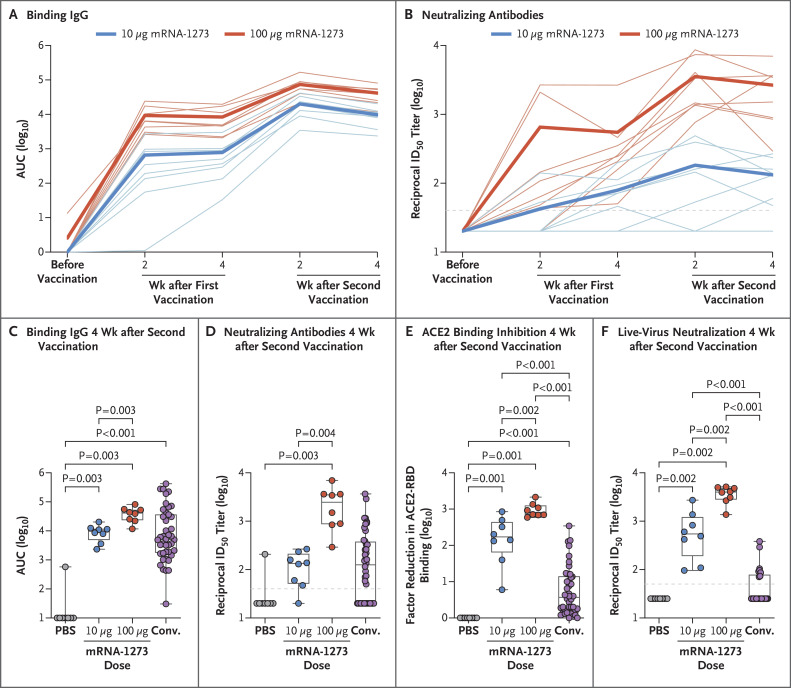
Figure 1. Antibody Responses after mRNA-1273 Vaccination in Rhesus Macaques.
Animals were administered phosphate-buffered saline (PBS) as a control or 10 μg or 100 μg of mRNA-1273. Serum specimens were assessed for severe acute respiratory syndrome coronavirus 2 (SARS-CoV-2) S-specific IgG by enzyme-linked immunosorbent assay (ELISA) (Panel A) and SARS-CoV-2 pseudovirus neutralization (Panel B) at all time points after the first and second vaccinations. Data in Panel A are the area under the curve (AUC) and indicate the amount of IgG binding to S-2P over time, and data in Panel B are the reciprocal 50% inhibitory dilution (ID50). Faint lines in Panels A and B represent individual animals, and bold lines represent the geometric mean titer for each group. S-specific IgG (Panel C), pseudovirus neutralization (Panel D), inhibition of angiotensin-converting enzyme 2 (ACE2) binding to the receptor-binding domain (RBD) (Panel E), and live-virus neutralization by NanoLuc reporter assay (Promega) (Panel F) were assessed at 4 weeks after the second vaccination, immediately before challenge. Results were compared with the antibody responses in a panel of human convalescent-phase serum specimens (Conv.) (42 specimens in Panels C, D, and E and 26 specimens in Panel F). In Panel E, the amount of signal emitted in wells containing no specimen was used as the maximal binding response against which each factor reduction was measured. In the box-and-whisker plots, the horizontal line indicates the median, the top and bottom of the box the interquartile range, and the whiskers the range. Symbols represent individual animals and overlap with one another for equal values where constrained. Dashed lines indicate the assay limit of detection.

