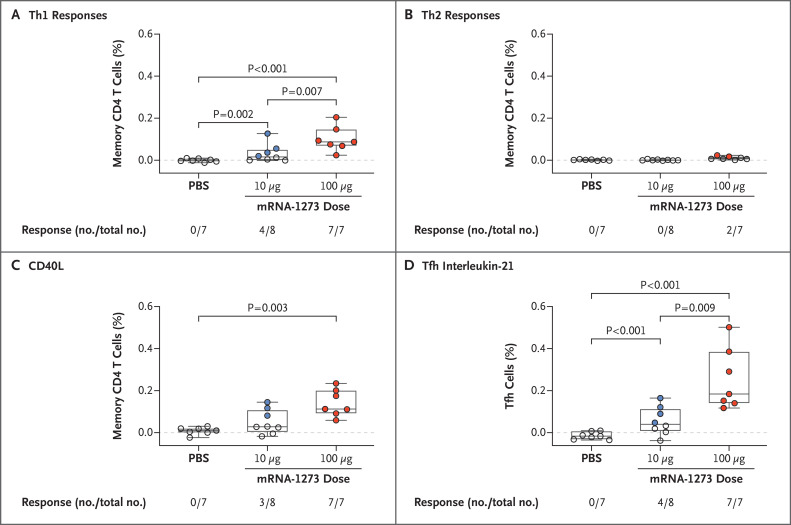
Figure 2. T-Cell Responses after mRNA-1273 Vaccination in Rhesus Macaques.
Intracellular staining was performed on peripheral blood mononuclear cells at 8 weeks, immediately before challenge, to assess T-cell responses to the SARS-CoV-2 S1 peptide pool. Panel A shows type 1 helper T-cell (Th1) responses (interferon-γ, interleukin-2, or tumor necrosis factor α), Panel B Th2 responses (interleukin-4 or 13), Panel C CD40L up-regulation, and Panel D interleukin-21 from peripheral follicular helper T (Tfh) cells (central memory CXCR5+PD-1+ICOS+ CD4 T cells). Positivity with respect to intracellular cytokine responses was determined with the MIMOSA algorithm; numbers of animals positive and total numbers of animals are shown as fractions below each group. In the box-and-whisker plots, the horizontal line indicates the median, the top and bottom of the box the interquartile range, and the whiskers the range. Open symbols represent animals with a probable nonresponse, and solid symbols represent animals with a probable response. Dashed lines are used to highlight 0.0%.

