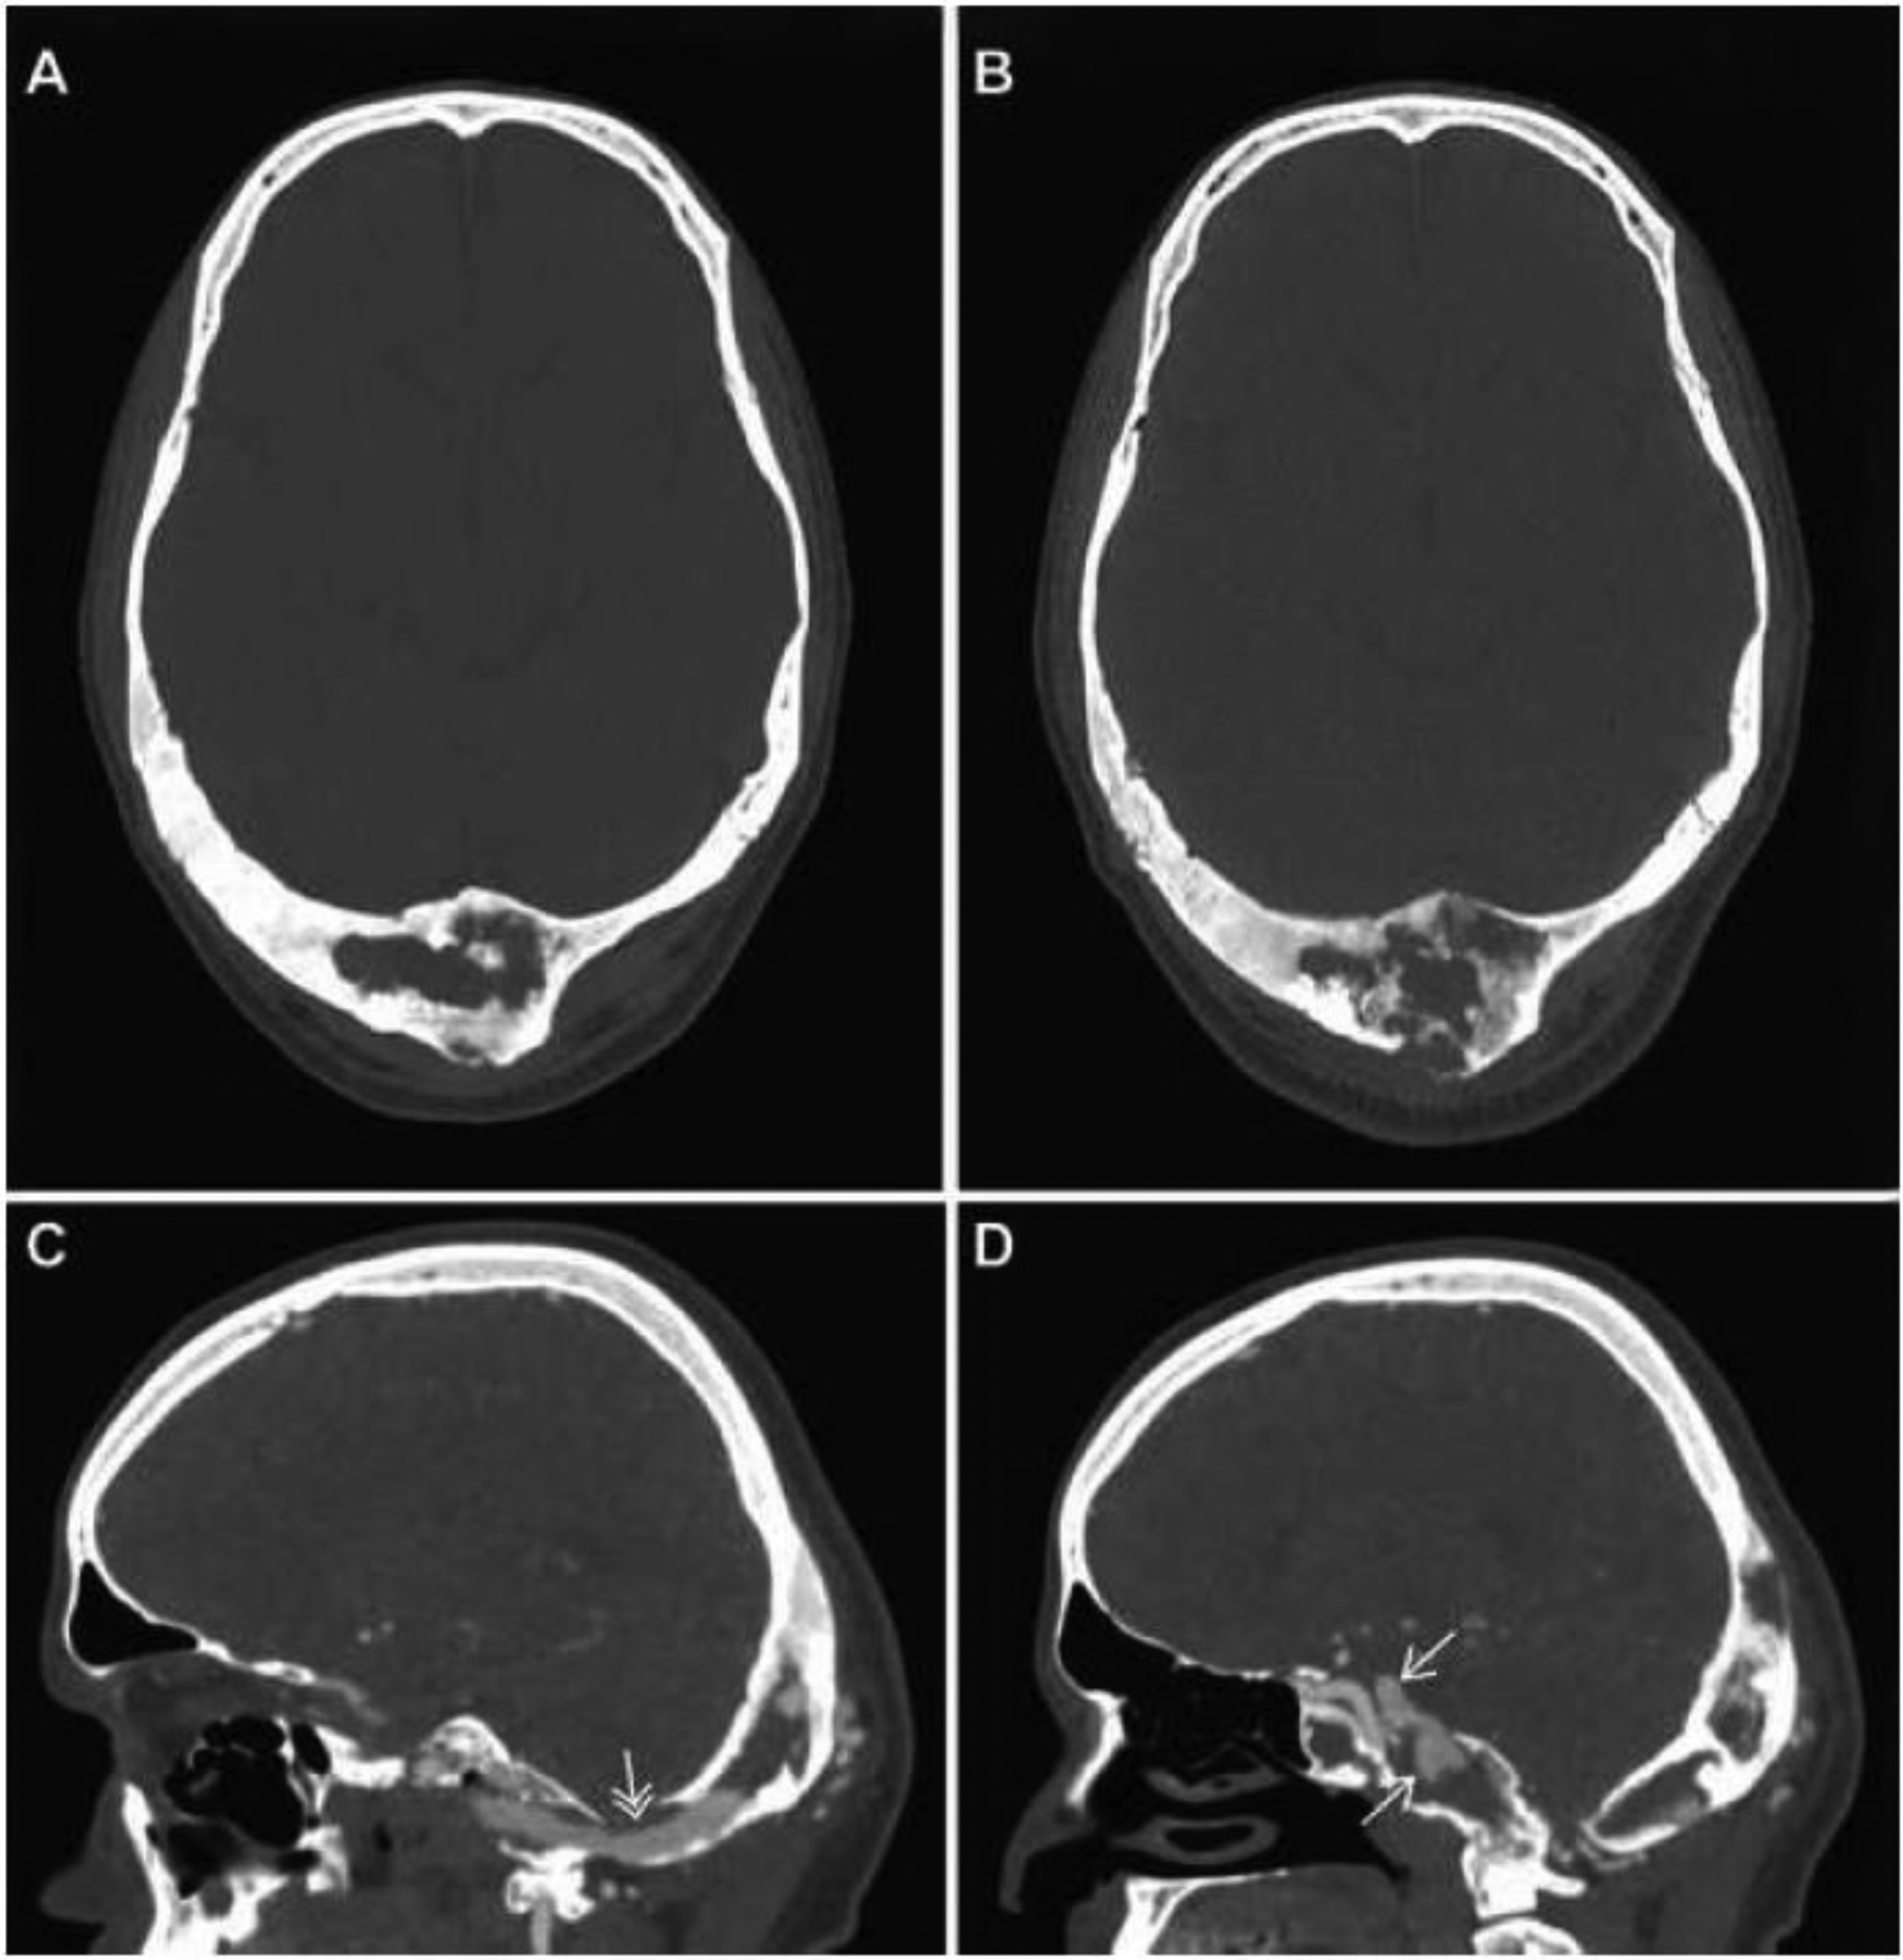
Figure 1.

Computed tomography imaging and angiography: Axial plane images of the occipital FD lesion in 2017 (A) and 2018 (B) demonstrate significant growth and lytic changes with cortical destruction over the course of one year. Sagittal CT images of an angiographic study (C & D) performed concurrent with the 2018 image (B) demonstrated a large arteriovenous fistula with an intraosseous draining vein (C, white double arrow) and distal venous aneurysms (D, white arrows).
