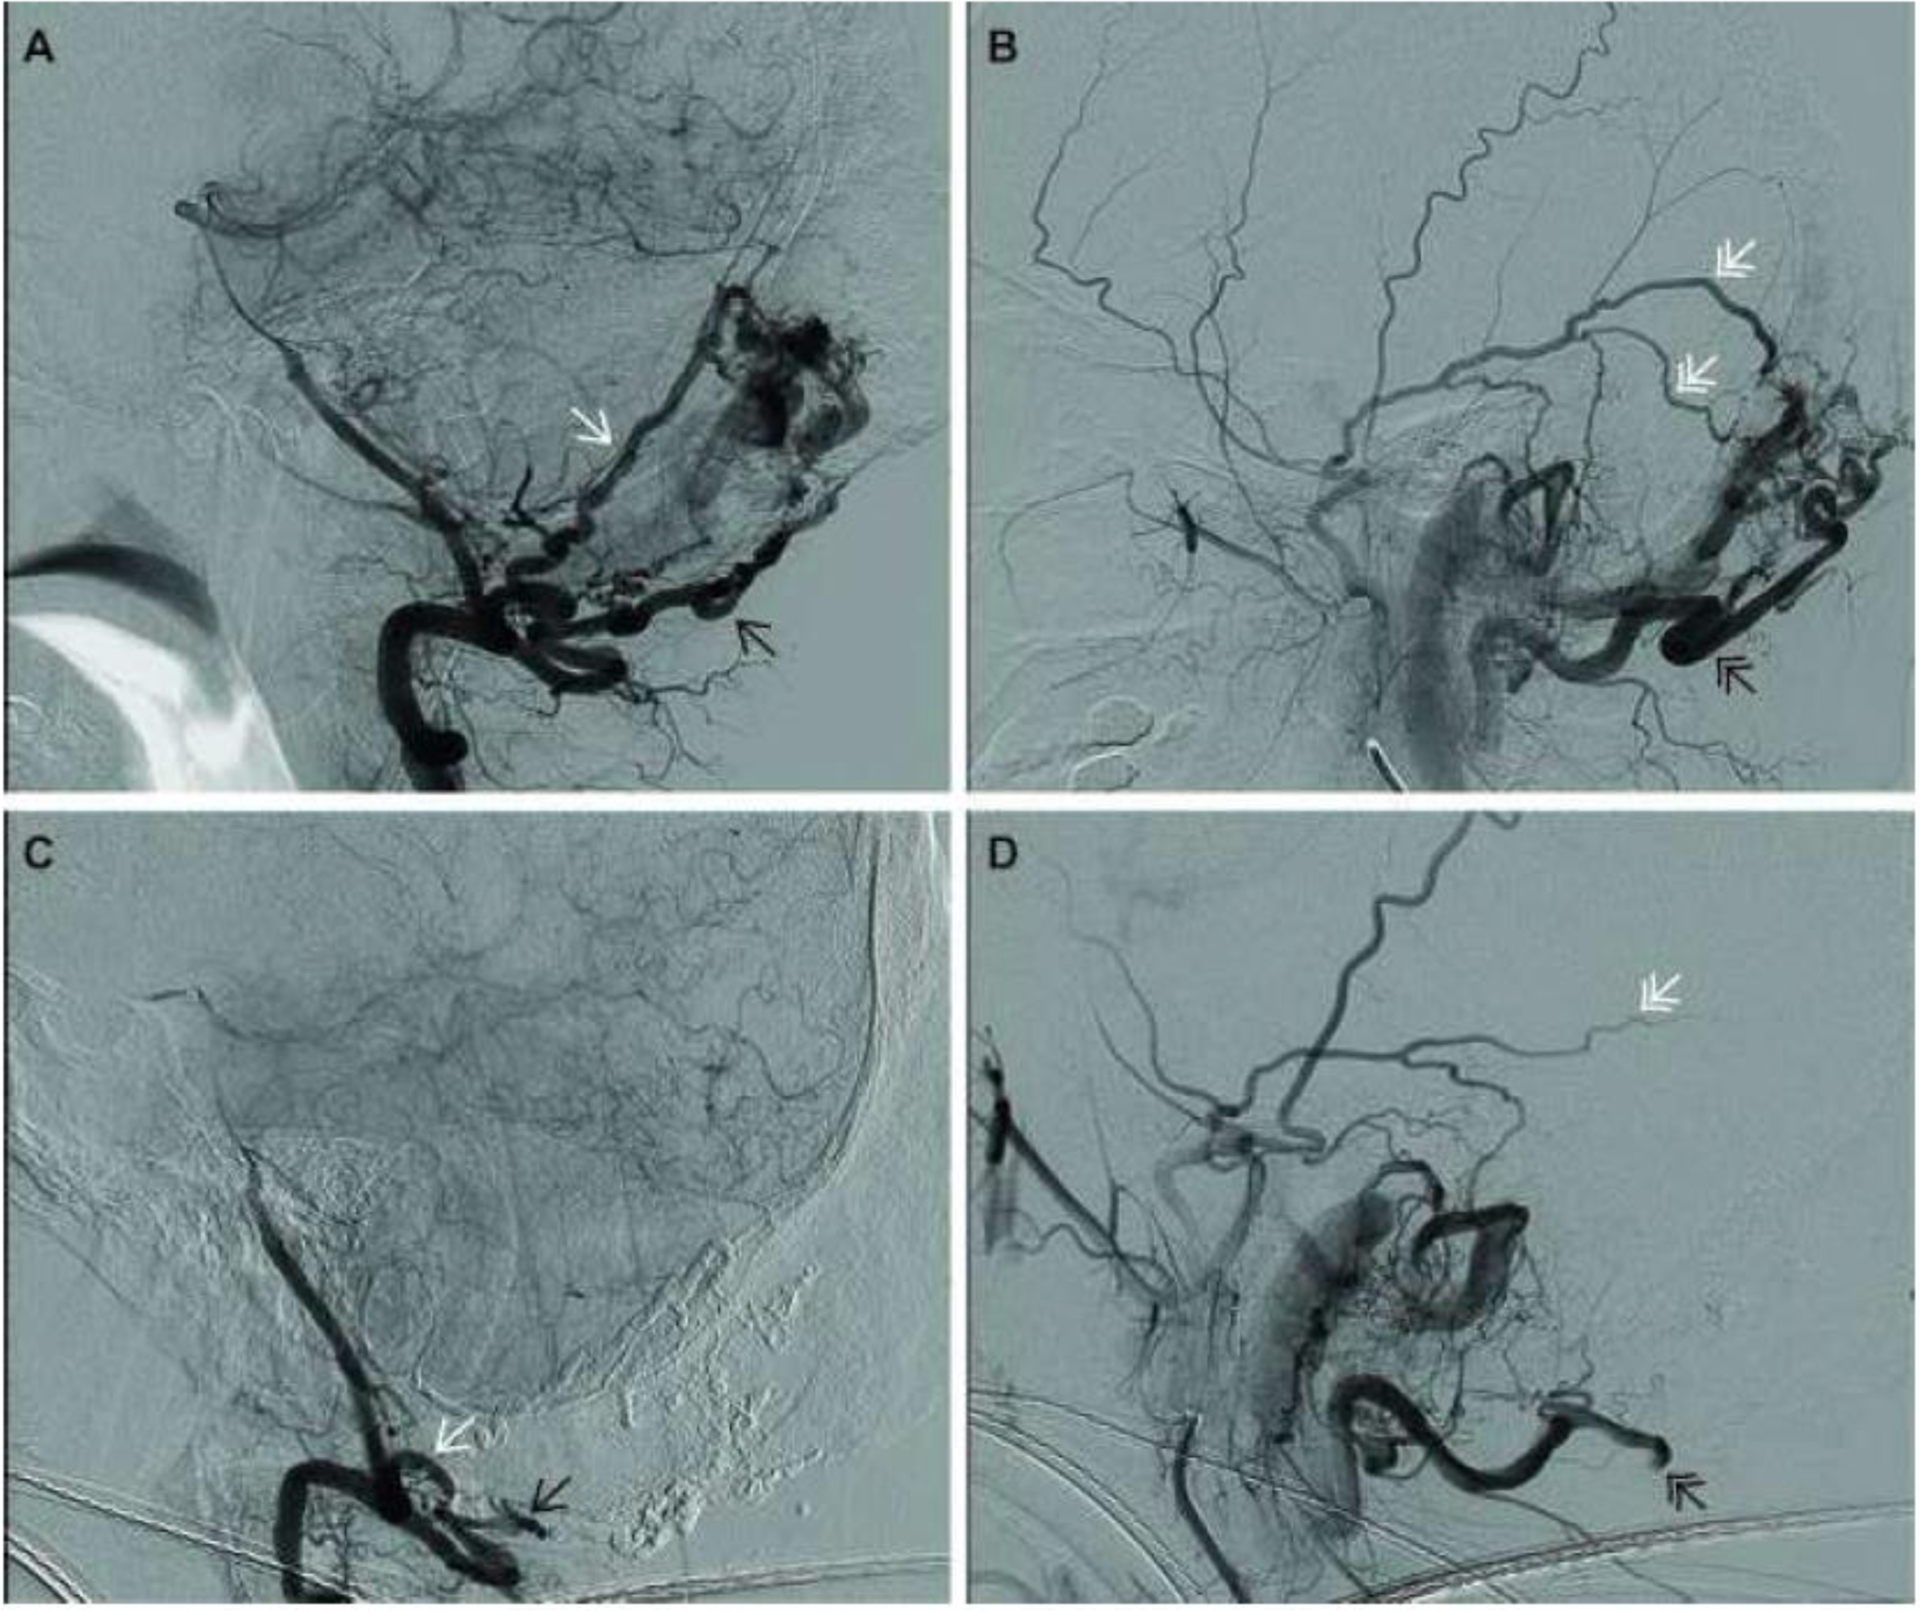
Figure 2.

Pre- and post-embolization arteriograms: Angiographic images taken prior to embolization (A&B), demonstrate dural (white arrow) and muscular (black arrow) branches of the right vertebral artery (A), and posterior branches of the middle meningeal artery (double white arrows), and occipital artery (double black arrow) (B). The image in panel C, which was taken following embolization and during the injection of contrast in the right vertebral artery, clearly demonstrates loss of the dural and muscular branches that were present in panel A and had been feeding the plexus of vessels in the occipital bone. The image in panel D, which was taken after embolization and during the injection of the posterior branches of the middle meningeal and occipital arteries, demonstrates loss or truncation of the vessels that had also been feeding the occipital plexus.
