FIGURE 2.

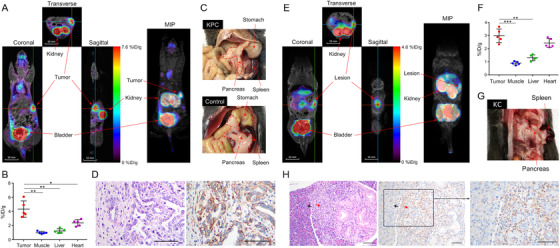
18F‐S5 PET/MR imaging in PDAC and PanIN mouse models. A, Representative cross‐sectional images of PET/MR imaging with 18F‐S5 of KPC mouse (left) and the 3D image (right). B, Quantification of 18F‐S5 uptake (%ID/g) by KPC mouse in tumor (4.34 ± 1.16), muscle (1.00 ± 0.17), liver (1.24 ± 0.33), and heart (2.38 ± 0.45), respectively. C, The pancreas of the KPC mouse showed an abnormal appearance compare to the pancreas of a healthy mouse. D, The development of PDAC in KPC mouse was confirmed by HE staining (left), and increased integrin α6 expression was confirmed by immunohistochemistry (right). E, Representative cross‐sectional images of PET/MR imaging of KC mouse (left) and the MIP reconstructed image (right). F, Quantification of 18F‐S5 uptake (%ID/g) by KC mouse in PanIN tissue (2.99 ± 0.52), muscle (0.89 ± 0.13), liver (1.31 ± 0.22), and heart (2.43 ± 0.35), respectively. G, The pancreas of the KPC mouse showed an abnormal appearance compare to the pancreas of a healthy mouse. H, The development of PanIN in mice was confirmed by HE staining (left), and the overexpression of integrin α6 in the lesion was analyzed using immunohistochemistry (right) (red arrow: PanIN; black arrow: relatively normal pancreatic tissue) (mean ± SD, the difference was evaluated by Student's t‐test, *P < .05, **P < .01, ***P < .001)
