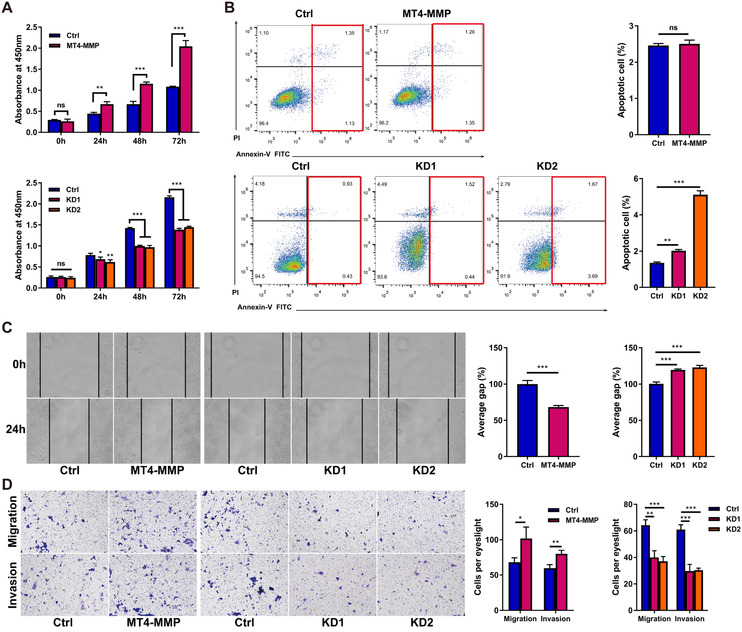
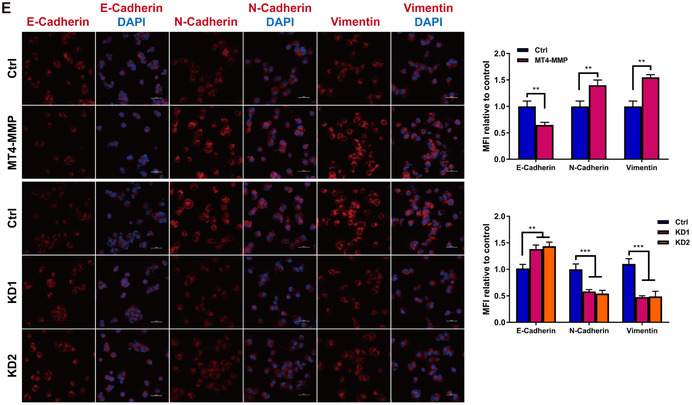
FIGURE 2.
HCC‐conditioned TAMs promote oncogenic behaviors of MHCC97H cells in vitro. MHCC97H cells were coincubated with TAM cells for 48 hours, and then cell experiments were conducted. (A) The CCK‐8 assay was used to examine cell viability. Upper panel: The effect of MT4‐MMP overexpression in TAMs on the cell proliferation ability of MHCC97H cells was tested by CCK‐8 assay. Lower panel: The influence of MT4‐MMP knockdown in TAMs on the cell proliferation ability of MHCC97H cells was tested by CCK‐8 assay. B, MHCC97H cell apoptosis after coculture by means of flow cytometry analysis of annexin‐V/PI staining. Left panel: MHCC97H cells distributed in annexin V scatter plots. The red box represents the late‐apoptotic cells in the upper right quadrant and shows the early‐apoptotic cells in the lower right quadrant. The upper left quadrant shows the necrotic cells, and the lower left quadrant shows the live cells. Right panel: Quantification of cell apoptosis. C, The scratch assay was used to examine cell migration. Left panel: Representative images of the scratch assay showing that TAMs with MT4‐MMP overexpression (MT4‐MMP) promoted the migration of MHCC97H cells in vitro and TAMs with MT4‐MMP knockdown (KD1 and KD2) inhibited the migration of MHCC97H cells in vitro. Right panel: Quantification of the results of the scratch assay, ×100 magnification. (D) Transwell migration and invasion assays showed that TAMs overexpressing MT4‐MMP promoted the migration and invasion of MHCC97H cells. Left panel: The bar graphs represent the number of migrating and invading cells after 48 hours. Right panel: Quantification of the results of transwell assays, × 100 magnification. (E) Immunofluorescence staining of EMT‐related markers showed that TAMs overexpressing MT4‐MMP promoted EMT in MHCC97H cells in vitro. Left panel: Representative images of EMT‐related markers in each group, scale bar = 50 μm. Right panel: Quantification of EMT‐related marker staining in MHCC97H cells. All histogram bars represent mean ± SEM. *P < .05, **P < .01, ***P < .001 versus the control group (Ctrl). Three experimental replicates in all panels


