
Figure 3.
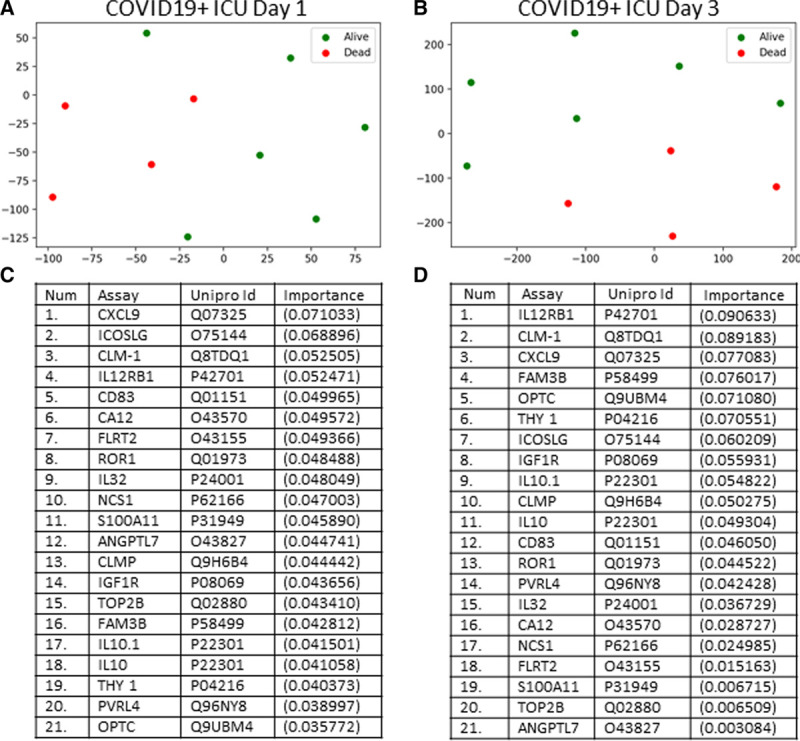
Targeted proteomics accurately differentiates coronavirus disease 2019 positive (COVID19+) patients that lived or died on ICU days 1 and 3. A, COVID19+ ICU patients plotted in 2D following dimensionality reduction of their respective outcomes (alive or dead) by stochastic neighbor embedding. Green dots represent COVID19+ ICU patients who survived, whereas red dots represent COVID19+ ICU patients who died (ICU day 1 plasma for both populations). The dimensionality reduction shows that based on the plasma proteome, the two cohorts are distinct and easily separable (92% classification accuracy). The axes are dimension less. B, COVID19+ ICU patients plotted in 2D following dimensionality reduction of their respective outcomes (alive or dead) by stochastic neighbor embedding (ICU day 3 plasma for both populations). Green dots represent COVID19+ ICU patients who survived, whereas red dots represent COVID19+ ICU patients who died. The dimensionality reduction shows that based on the plasma proteome, the two cohorts are reasonably distinct and separable (83% classification accuracy). The axes are dimension less. C, Feature classification demonstrating the top 21 plasma proteins obtained on ICU day 1 that classify outcome for COVID19+ ICU patients with their % association. D, Feature classification demonstrating the top 21 plasma proteins obtained on ICU day 3 that classify outcome for COVID19+ ICU patients with their % association.