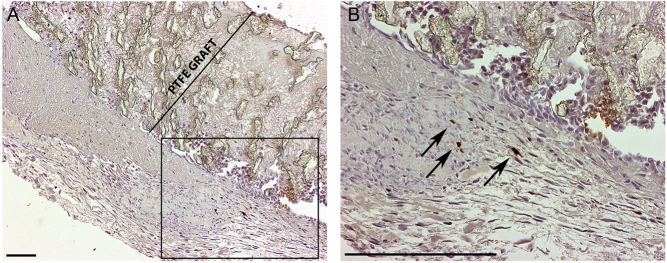
Figure 1.
Marker gene expression. B-galactosidase stain with 40× (A) and 100× (B) magnification with (B) showing a higher magnification from the area boxed in (A). The graft wall is marked for clarity in (A). Transduced cells were seen 6 days after surgery and AdLacZ gene transfer (dark brown nuclei indicated with arrows in (B)). Scale bars 200 µm.

 This work is licensed under a