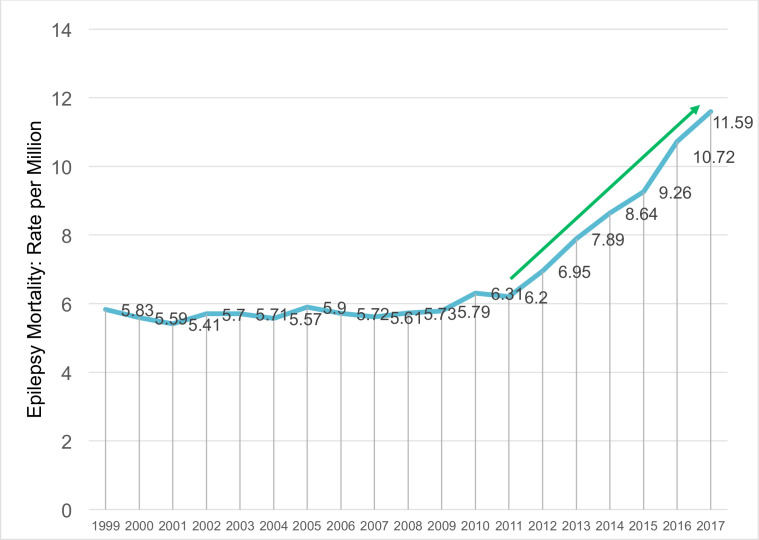
Figure 1.
Epilepsy age-adjusted mortality rates, 1999 to 2017: multiple cause-of-death mortality rates. Rates are expressed as number per million. The change in slope from 2010 to 2017 was significantly increased compared with 1999 to 2009 (weighted linear regression model with piecewise linear splines, p=0.001).

