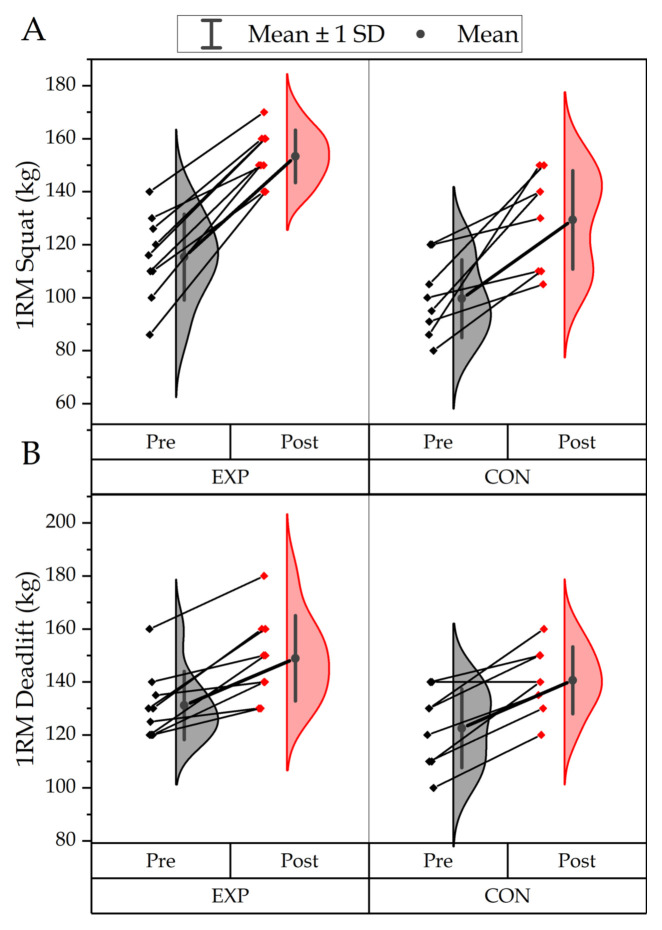
Figure 1.
Individual participant changes in 1RM squat mass (panel A) and 1RM deadlift mass (panel B) following the 6-week intervention in male collegiate soccer players. The distribution of the data is represented by the violin plot. Thin black lines represent the pre-to-post intervention changes. Thick black lines represent the mean pre-to-post intervention change. The margin of error on the mean is represented with 1SD.

