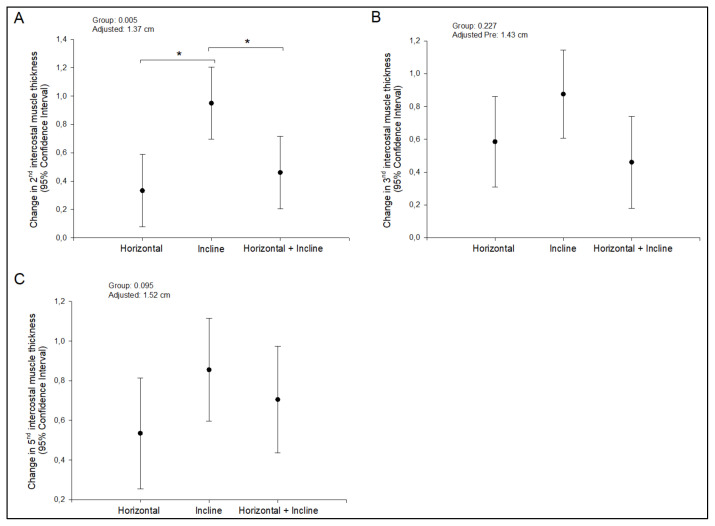
Figure 4.
The pre to post change in muscle thickness at the 2nd intercostal (A), 3rd intercostal (B), and 5th intercostal (C) across the three separate training groups. Each value reported was adjusted for the baseline value with the middle dot representing the change with the variability represented by 95% confidence intervals. * represents a significant between group difference in the change in load lifted.

