
Table 2.
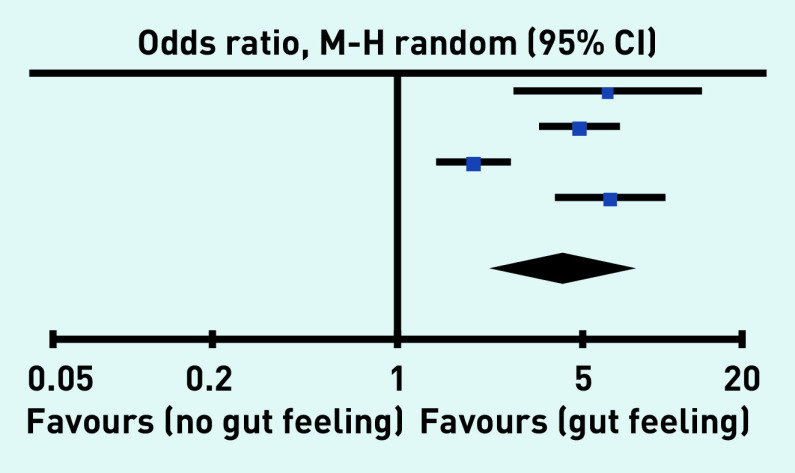
Odds of cancer diagnosis with gut feeling
| Study | Gut feeling, n | No gut feeling, n | Weight, % | Odds ratio, M-H random (95% CI) | |||
|---|---|---|---|---|---|---|---|
| Cancer diagnoses | Total patients | Cancer diagnoses | Total patients | ||||
| Hjertholm et al (2014)34 | 8 | 256 | 22 | 4262 | 19.8 | 6.22 (2.74 to 14.11) |
|
| Holtedahl et al (2017)33 | 64 | 1097 | 65 | 5167 | 27.3 | 4.86 (3.42 to 6.91) | |
| Ingeman et al (2015)35 | 69 | 287 | 138 | 982 | 27.6 | 1.94 (1.40 to 2.68) | |
| Scheel (2014)38 | 58 | 1515 | 24 | 3854 | 25.4 | 6.35 (3.93 to 10.26) | |
| Total | — | 3155 | — | 14 265 | 100 | 4.24 (2.26 to 7.94) | |
| Total cancer diagnoses | 199 | — | 249 | — | — | — | |
Heterogeneity: Tau2= 0.34; c2= 23.96; degrees of freedom = 3 (P < 0.0001); l2 = 87%. Test for overall effect: Z = 4.51 (P < 0.00001). M-H = Mantel-Haenszel.