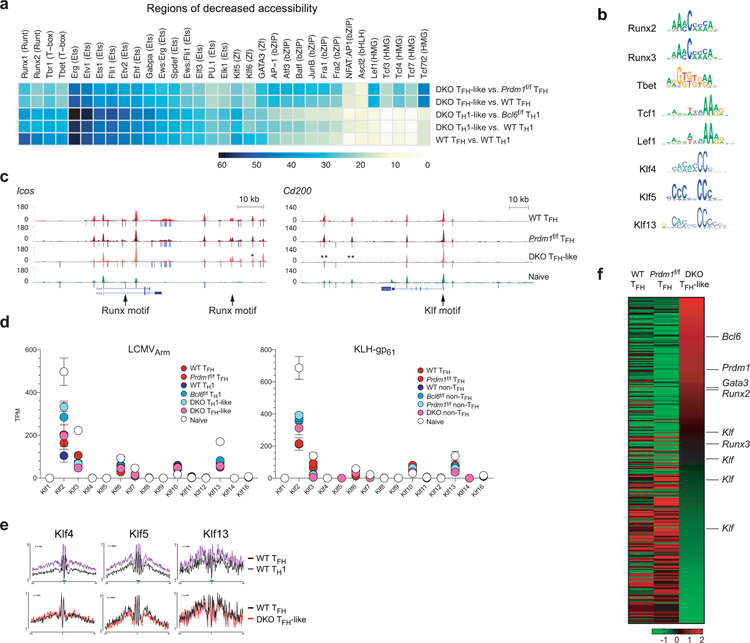
Extended Data Fig. 6. Identification of candidate TFs.
Related to Fig. 6
a, Heatmap plots representing the frequencies of the most enriched TF motifs in regions in decreased accessibility (relatively less open in first group than second group, DEseq2 raw p-val < 0.05). Scale, motif frequencies (%). Related to Fig.6b.
b, Motif analysis of the center of TF footprint (green bar) in Fig.6c and Extended Data Fig.6e from ATAC-seq reads.
c, Genome-browser tracks depict ATAC-seq chromatin accessibility and TF occupancy at Icos and Cd200 loci. Peak calls indicated below each track. ** indicates DEseq2 raw p-val ≤ 0.01 in comparison between Bcl6f/fPrdm1f/f CreCD4 TFH-like and Prdm1f/f CreCD4 TFH.
d, Gene expression of Klf genes from RNA-seq data of LCMVArm infected mice or KLH-gp61 immunized mice.
e, TF footprints derived from ATAC-seq reads over representative TF motifs within accessible ATAC-seq regions.
f, Heatmap plots of relative PageRank scores. Scale, row z-score.

