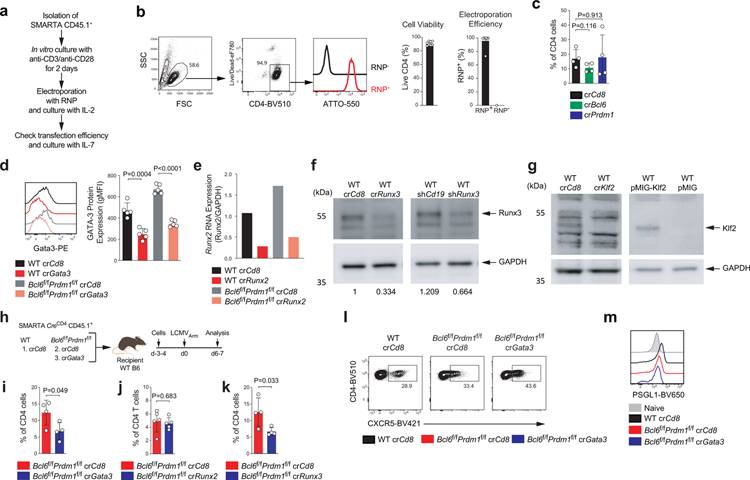
Extended Data Fig. 7. CRISPR/Cas9-mediated gene knockdown of SMARTA cells.
Related to Fig. 7
a, Schematic of the CRISPR/Cas9-mediated gene knockdown of SMARTA cell system. Details are in the Method section.
b, Representative flow cytometry of RNP transfection from more than four independent experiment; each dot represents one RNP+ group (n = 9). Data are mean ± s.d. Quantification of cell viability and transfection efficiency of RNP+ and RNP− (electroporation without RNP) SMARTA cells.
c, Frequency of crRNA+ CD45.1+ SMARTA cells among total CD4 T cells from spleen of LCMVArm infected mice in Fig.7a. Two independent experiments were performed; each dot represents one crRNA+ group (n = 4). Data are mean ± s.d., unpaired two-tailed Student’s t-test.
d,e,f,g, WT or Bcl6f/fPrdm1f/f CreCD4 SMARTA CD4 T cells transfected with crCd8, crGata3, crRunx2, crRunx3, and crKlf2 were transferred to C57BL/6 host mice, followed by infection with LCMVArm (e,f,g) or immunization with KLH-gp61 (d) of the host mice, and analyzed 6–7 days later. crRNA+ SMARTA cells were FACS sorted from spleens (LCMVArm infection) or dLN (KLH-gp61 immunization) of host mice. Gene knockdown efficiencies were measured by flow cytometry (d), mRNA qPCR (e), or Western blot analysis (f,g). shRunx3-RV+ SMATRA cells and pMIG-Klf2-RV+ SMARTA cells were used as positive controls. Two independent experiments were performed; Each dot represents one mouse (n = 5). Data are mean ± s.d., unpaired two-tailed Student’s t-test. Details are in the Method section.
h, Schematic of the CRISPR/Cas9-mediated gene knockdown of SMARTA cell system used for testing Gata3 in LCMVArm infection. WT or Bcl6f/fPrdm1f/f CreCD4 SMARTA CD4 T cells transfected with crCd8 or crGata3 were transferred to C57BL/6 host mice, followed by infection of the host mice with LCMVArm, and analyzed 6–7 days later. Related to Fig.7c and Extended Data Fig.7i,l,m.
i,j,k, Frequency of crRNA+ CD45.1+ SMARTA cells among total CD4 T cells from spleen of LCMVArm infected mice in Fig.7d and Extended Data Fig.7h. Two (i) or three (j,k) independent experiments were performed; each dot represents one mouse (n = 4). Data are mean ± s.d., unpaired two-tailed Student’s t-test.
l, Representative flow cytometry of TFH SMARTA cell subsets from spleen of LCMVArm infected mice in Extended Data Fig.7h. Two independent experiments were performed; Each dot represents one mouse (n = 4). Data are mean ± s.d., unpaired two-tailed Student’s t-test.
m, Quantification of expression of PSGL1 in Extended Data Fig.7h, gated on SMARTA cells. CD44lo naive CD4 T cells were used as a negative control.

