
Figure 8. Identification of Klf2 as a repressor acting downstream of Bcl-6 regulating major TFH genes.
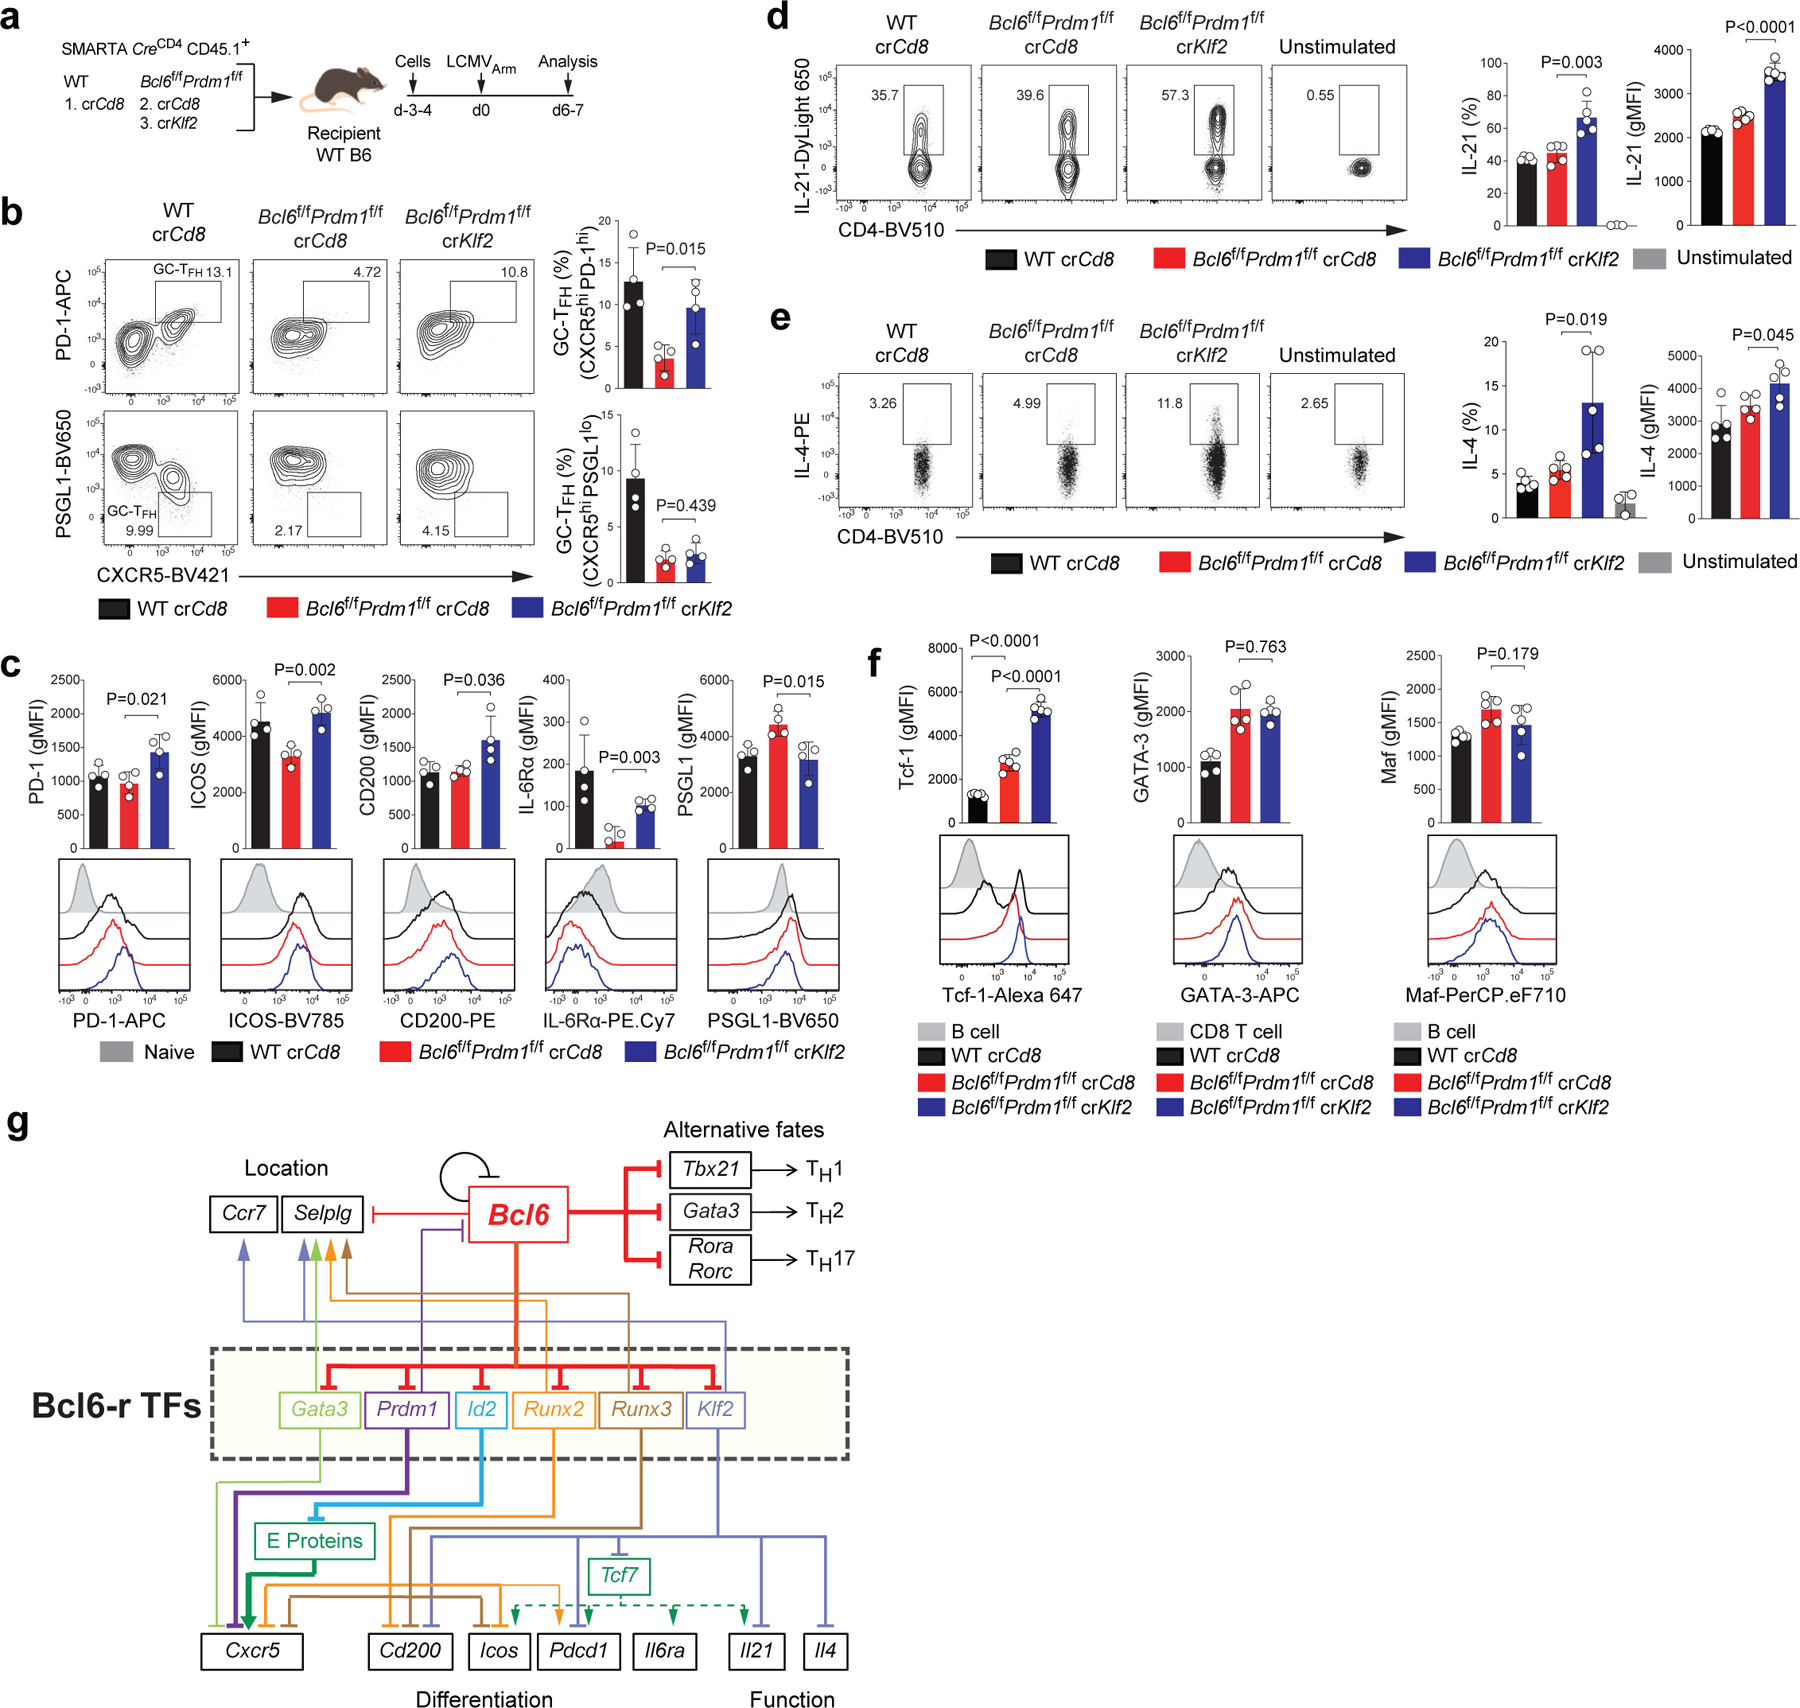
a, Schematic of the CRISPR/Cas9-mediated gene knockdown of SMARTA cell system used for testing Klf2 in LCMVArm infection. wild-type or Bcl6f/fPrdm1f/f CreCD4 SMARTA CD4+ T cells transfected with crCd8 or crKlf2 were transferred to C57BL/6 host mice, followed by infection of the host mice with LCMVArm, and analyzed 6–7 days later. See Fig.8b–c and Extended Data Fig.9a,b.
b, Representative flow cytometry of TFH and GC-TFH cells, gated on SMARTA cells from spleens of LCMVArm infected mice in a. Three independent experiments were performed; each dot represents one mouse (n = 4). Data are mean ± s.d., unpaired two-tailed Student’s t-test.
c, Quantification of GC-TFH core signature markers, gated on SMARTA cells from spleens of LCMVArm infected mice in a. CD44lo naive CD4+ T cells were used as a negative control.
d,e, wild-type or Bcl6f/fPrdm1f/f CreCD4 SMARTA CD4+ T cells transfected with crCd8 or crKlf2 were transferred to C57BL/6 host mice, followed by immunization of the host mice with KLH-gp61 and alum + cGAMP, and analyzed 8 days later. Representative flow cytometry and quantification of gp66-restimulated IL-21+ and IL-4+ SMARTA cells from dLNs of KLH-gp61 immunized mice. Two independent experiments were performed; each dot represents one mouse (n = 5). Data are mean ± s.d., unpaired two-tailed Student’s t-test. See Extended Data Fig.9d for experimental design.
f, Quantification of expression of Tcf-1, GATA-3, and Maf, gated on SMARTA cells from dLNs of KLH-gp61 immunized mice in Extended Data Fig.9d.
g, A circuitry model of the regulation of TFH genes upregulated by Bcl-6 through repression of repressor TFs.