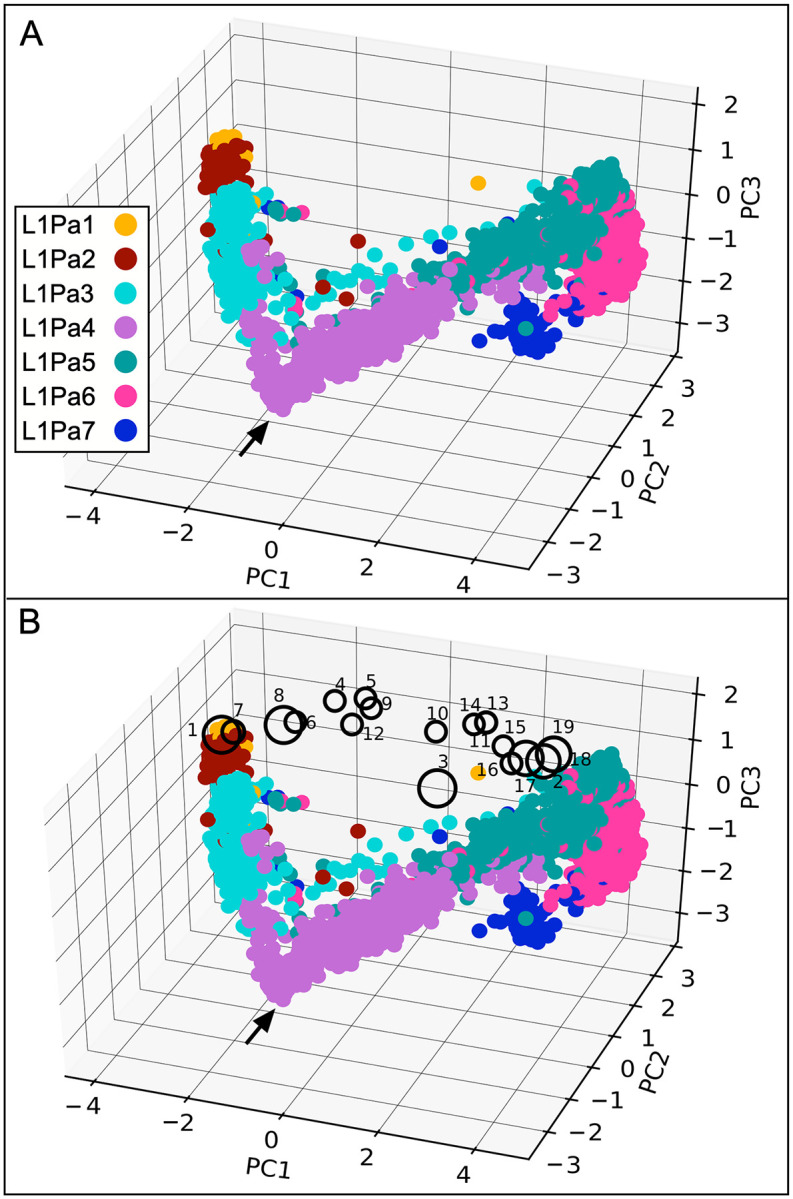
Fig 2. Principal component analysis of the ORF1p coiled coil.

A—The color code used for each family corresponds to one of the major clusters shown in Fig 3. B—Large and small circles correspond respectively to active and inactive ORF1p variants mapped on the sequence space of the coiled coil of L1pa7-L1Pa1 and are numbered per Fig 1 and S3 Fig. Active variants (large circles) exhibited ~80–100% of L1Pa1 activity and inactive ones (small circles) <5% of L1Pa1 activity.
