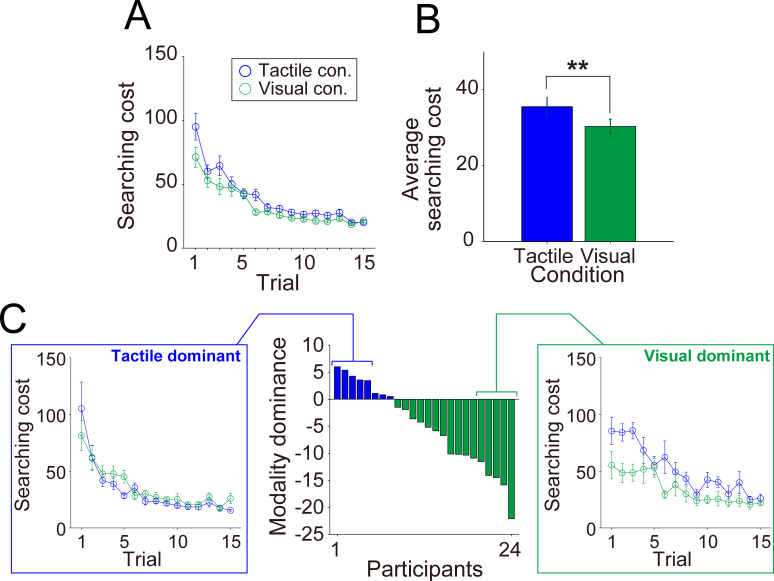
Fig 2. Searching cost transitions and individual WM modality dominance.
The top panels show motor performance within the entire cohort, prior to individual modality dominance labeling. (A) Average trial-by-trial searching cost transition under tactile (blue) and visual (green) conditions. (B) Average searching cost under both conditions. (C) Differential searching costs between tactile and visual conditions sorted in descending order. Positive and negative values indicate individuals with tactile dominance (TD; blue bars) and visual dominance (VD; green bars), respectively. The left and right panels show the typical trial-by-trial searching cost transition in TD (participant nos. 1–5) and VD (participant nos. 20–24) individuals. Error bars denote the standard error. **p < 0.01.

