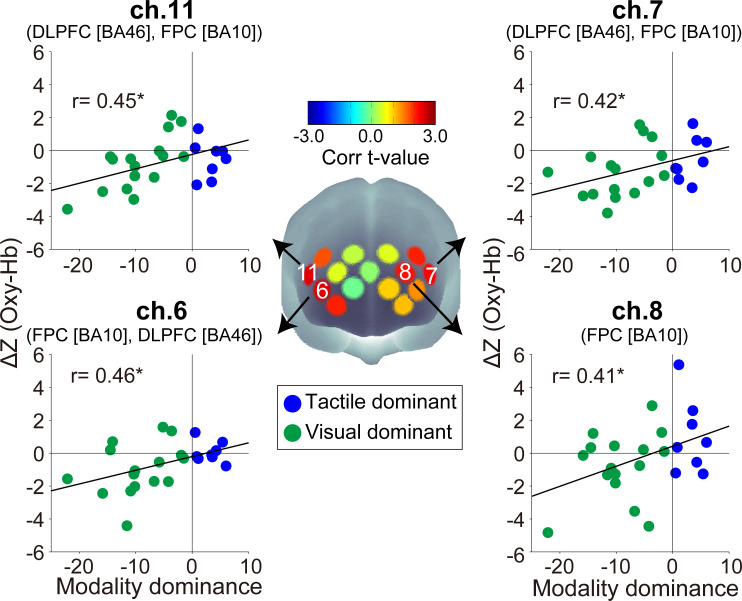
Fig 3. Spatial configurations of the t-values from correlation analysis between individual modality dominance and ΔZ (Oxy-Hb).
Scatter plots show the inter-subject distributions in channels with significant correlation coefficients. The positive and negative values of ΔZ indicate increasing and decreasing activity, respectively. BA: Brodmann area, *p < 0.05 (uncorrected).

