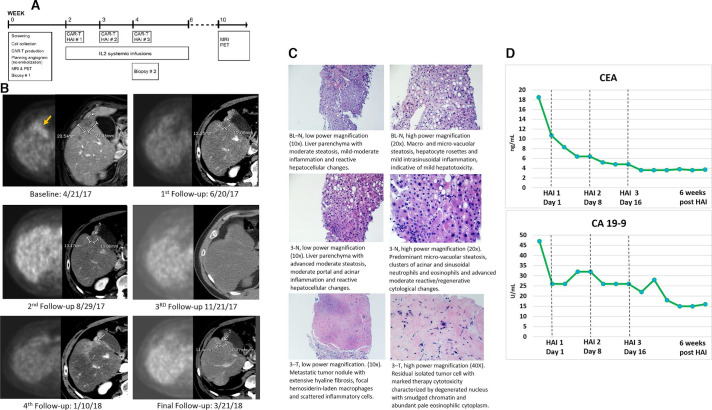
Figure 1.
(A) Trial schematic. (B) Sequential imaging demonstrates complete metabolic response to intrahepatic CAR-T therapy. Each imaging time point is depicted with an image from a contrast-enhanced CT of the abdomen and a corresponding attenuation corrected PET image. The lesion, which is located adjacent to the gallbladder at the border between segments 4B and 5, is FDG avid at baseline and shows no activity on the first follow-up scan or any of the later time points. RECIST assessment of the lesion on CT shows partial response from baseline to the first time point, and stable disease from that time on. Note that there is increased peri-lesional enhancement on January 10, 2018; this is likely due to a transient perfusion abnormality and the timing of image acquisition in relationship to contrast administration. (C) H&E stain of non-neoplastic liver parenchyma (N) at baseline and HAI 3, and metastatic tumor (T) collected at HAI 3. (D) Serum CEA and CA 19–9 were trended throughout the course of the study. Both tumor markers exhibited a continuous downward trend before normalizing following CAR-T HAI. This biochemical response correlated with the radiographic imaging, in addition to the post-treatment pathologic findings. CAR-T, chimeric antigen receptor T-cells; CEA, carcinoembryonic antigen; HAI, hepatic artery infusion; IL, interleukin; PET, positron emission tomography; FDG, fluorodeoxyglucose.

