Figure 4.
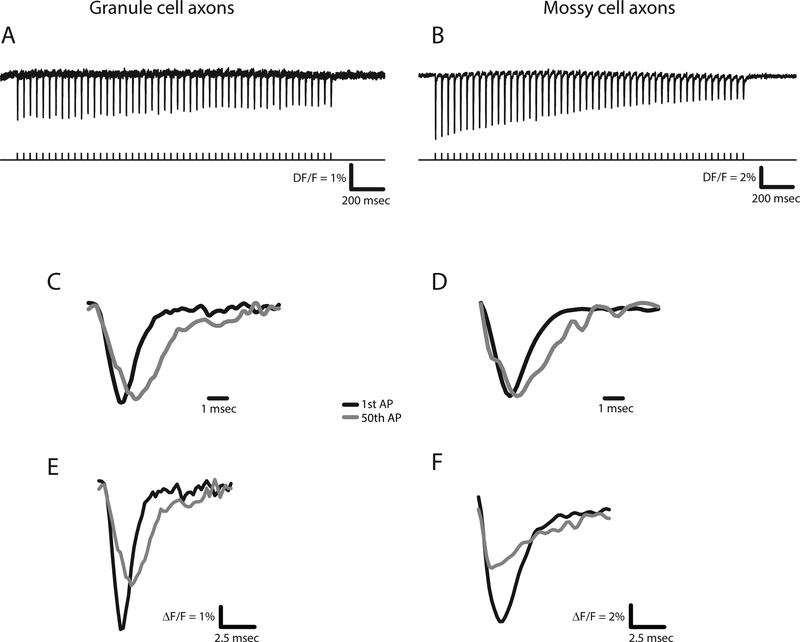
Activity-dependent changes in action potentials determined with the axonally targeted hVOS probe described in Fig. 3. Action potentials elicited by a 25 Hz train of 50 pulses in the axons of granule cells (A) and mossy cells (B). The first and last action potentials seen in the hVOS signals from each train were superimposed (C and D). Normalization to the peak fluorescence change highlights the differences in breadth (WHM). First and last action potentials are superimposed without normalization to highlight the reduction in amplitude (E and F). (reproduced from [43], see this paper for quantitative analysis of action potential broadening and attenuation).

