
Figure 4. Plot of neutral H2SO4 dimer against monomer concentrations before and after the addition of DMA.
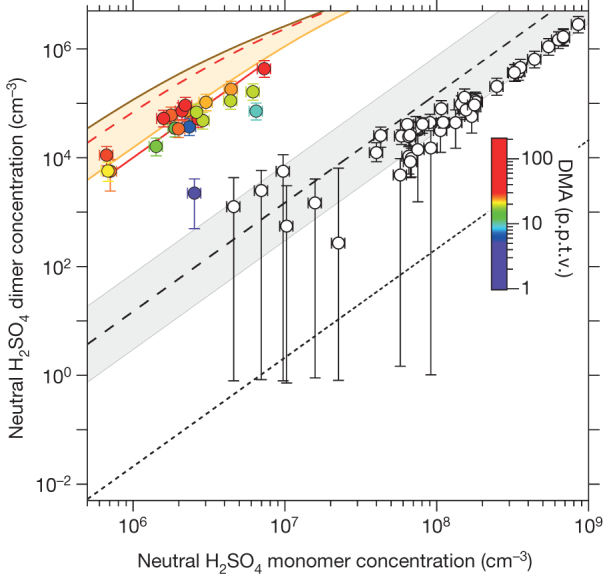
Concentrations were measured by the CIMS in CLOUD without DMA (open circles) and with 3–140 p.p.t.v. DMA and 10 p.p.t.v. NH3 (coloured circles), at 38% RH and 278 K. Ions are absent from the CLOUD chamber (the clearing field is on). The bars indicate 1σ counting errors. The fitted red curve through the DMA data shows a quadratic dependence on monomer concentration. The other curves show the expected neutral dimer concentrations for the binary H2SO4–H2O system (short-dashed black line)26, for production in the CIMS ion source (dashed black line and grey uncertainty band) and for 10 p.p.t.v. DMA in the ACDC model, assuming 0.5 sticking probability (dashed red line). The orange band shows the model uncertainty range (sticking probabilities between 0.1 and 1.0). The brown curve indicates the upper limit of the dimer concentration calculated with the ACDC model, which is close to the kinetic limit (unit sticking probability and negligible evaporation).