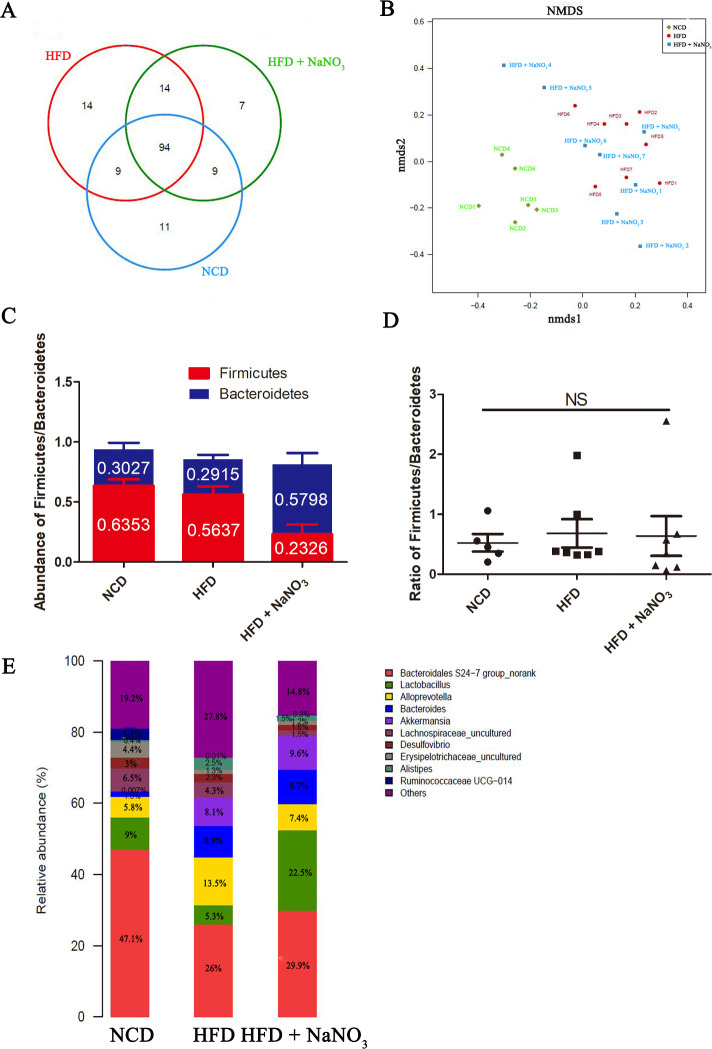
Figure 6.
Inorganic nitrate altered the relative abundances of the specific gut bacterial genus. (A) Numbers of unique and shared bacteria at the genus level. (B) NMDS analysis of the distribution of the gut microbiome among the three groups. (C) The average abundance of Firmicutes and Bacteroidetes at the phylum level in each group. (D) The ratio of Firmicutes to Bacteroidetes in different groups. (E) Top 10 abundant bacteria at the genus level in each group. HFD, high-fat diet; NCD, normal control diet; NMDS, nonmetric multidimensional scaling; NS, not significant.

