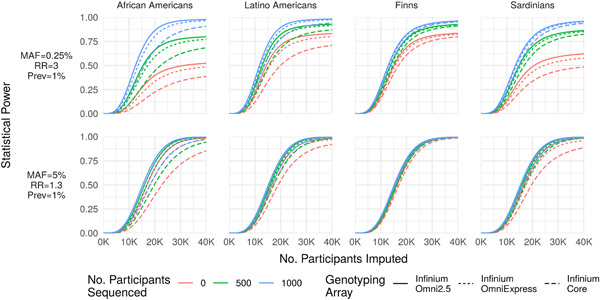
Figure 3.

Power as a function of MAF and effect size. Statistical power (y‐axis) to detect a rare large‐effect variant (MAF = 0.25%, RR = 3; top row) and common modest‐effect variant (MAF = 5%, RR = 1.3; bottom row) for a disease with prevalence 1% as a function of the number of participants array‐genotyped and imputed (x‐axis) when 0, 500, or 2,000 participants are sequenced and included in an augmented reference panel. The number of participants sequenced has a far greater impact on statistical power for the rare variant association. Importantly, statistical power is bounded above by the probability that the variant is imputable (r 2 > 0.3 and reference ), causing power to asymptote below 1 as a function of the number of imputed participants (e.g., upper‐left panel). MAC, minor allele count; MAF, minor allele frequency; RR, relative risk
