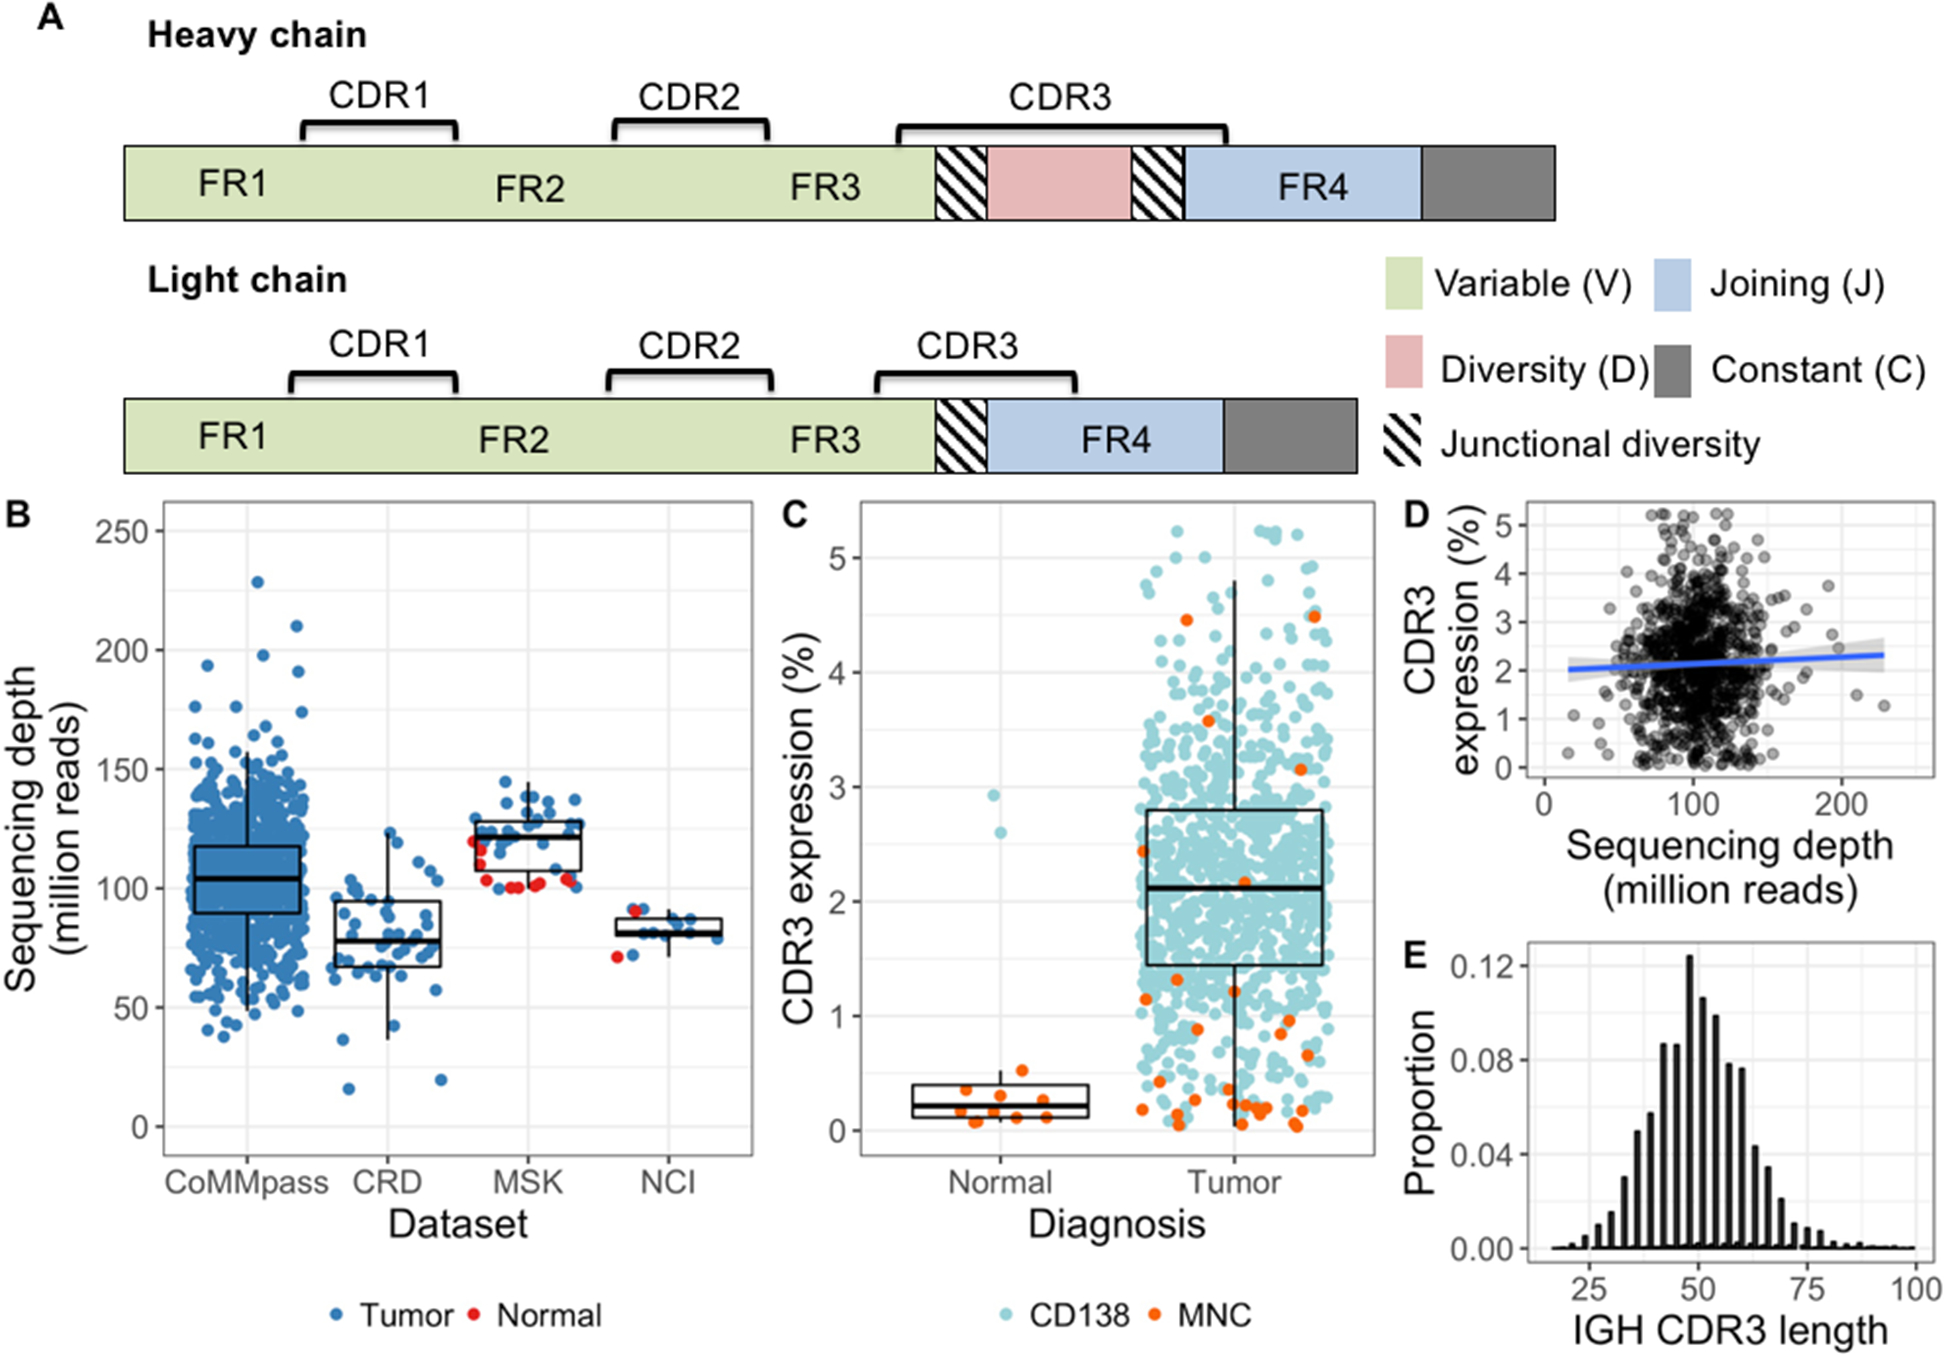
Figure 1.

Immunoglobulin CDR3 extraction and expression. A, Schematic of the immunoglobulin heavy (above) and light (below) chain genes. The complementarity determining regions (CDR) are hotspots for somatic hypermutation, while framework (FR) regions are more stable and commonly used as PCR primer targets. Greatest diversity is found in the CDR3, which spans part of each V(D)J segment and contains random junctional diversity in the form of deletions and non-templated insertions. Light chains lack a Dsegment and their variable region is therefore less variable than the heavy chain gene. B, Sequencing depth of each bone marrow sample. Median and quartile range within each cohort are shown as box and whisker plots. C, The proportion of total reads mapping to immunoglobulin CDR3s (i.e. CDR3 expression) shown by sample type and the cell subset analyzed. Enrichment of CD138+ bone marrow cells resulted in considerably higher CDR3 expression in both tumors and normals, as compared with bone marrow mononuclear cells (MNCs). In tumor samples, the median difference between CD138+ cells and MNCs was 5-fold (2.1% and 0.39%, respectively; P < 0.001). D, CDR3 expression was not related to total coverage (spearman’s rho = 0.01, p = 0.73) and therefore suitable for comparison between samples. Linear regression line fitted to the data is shown in blue, with the surrounding shaded area representing the 95% confidence interval. E, There was no sign of length bias in extracted CDR3 sequences, as the top 10 IGH CDR3s from each sample showed the expected normal-approximate length distribution around a mean of 50.
