Figure 2.

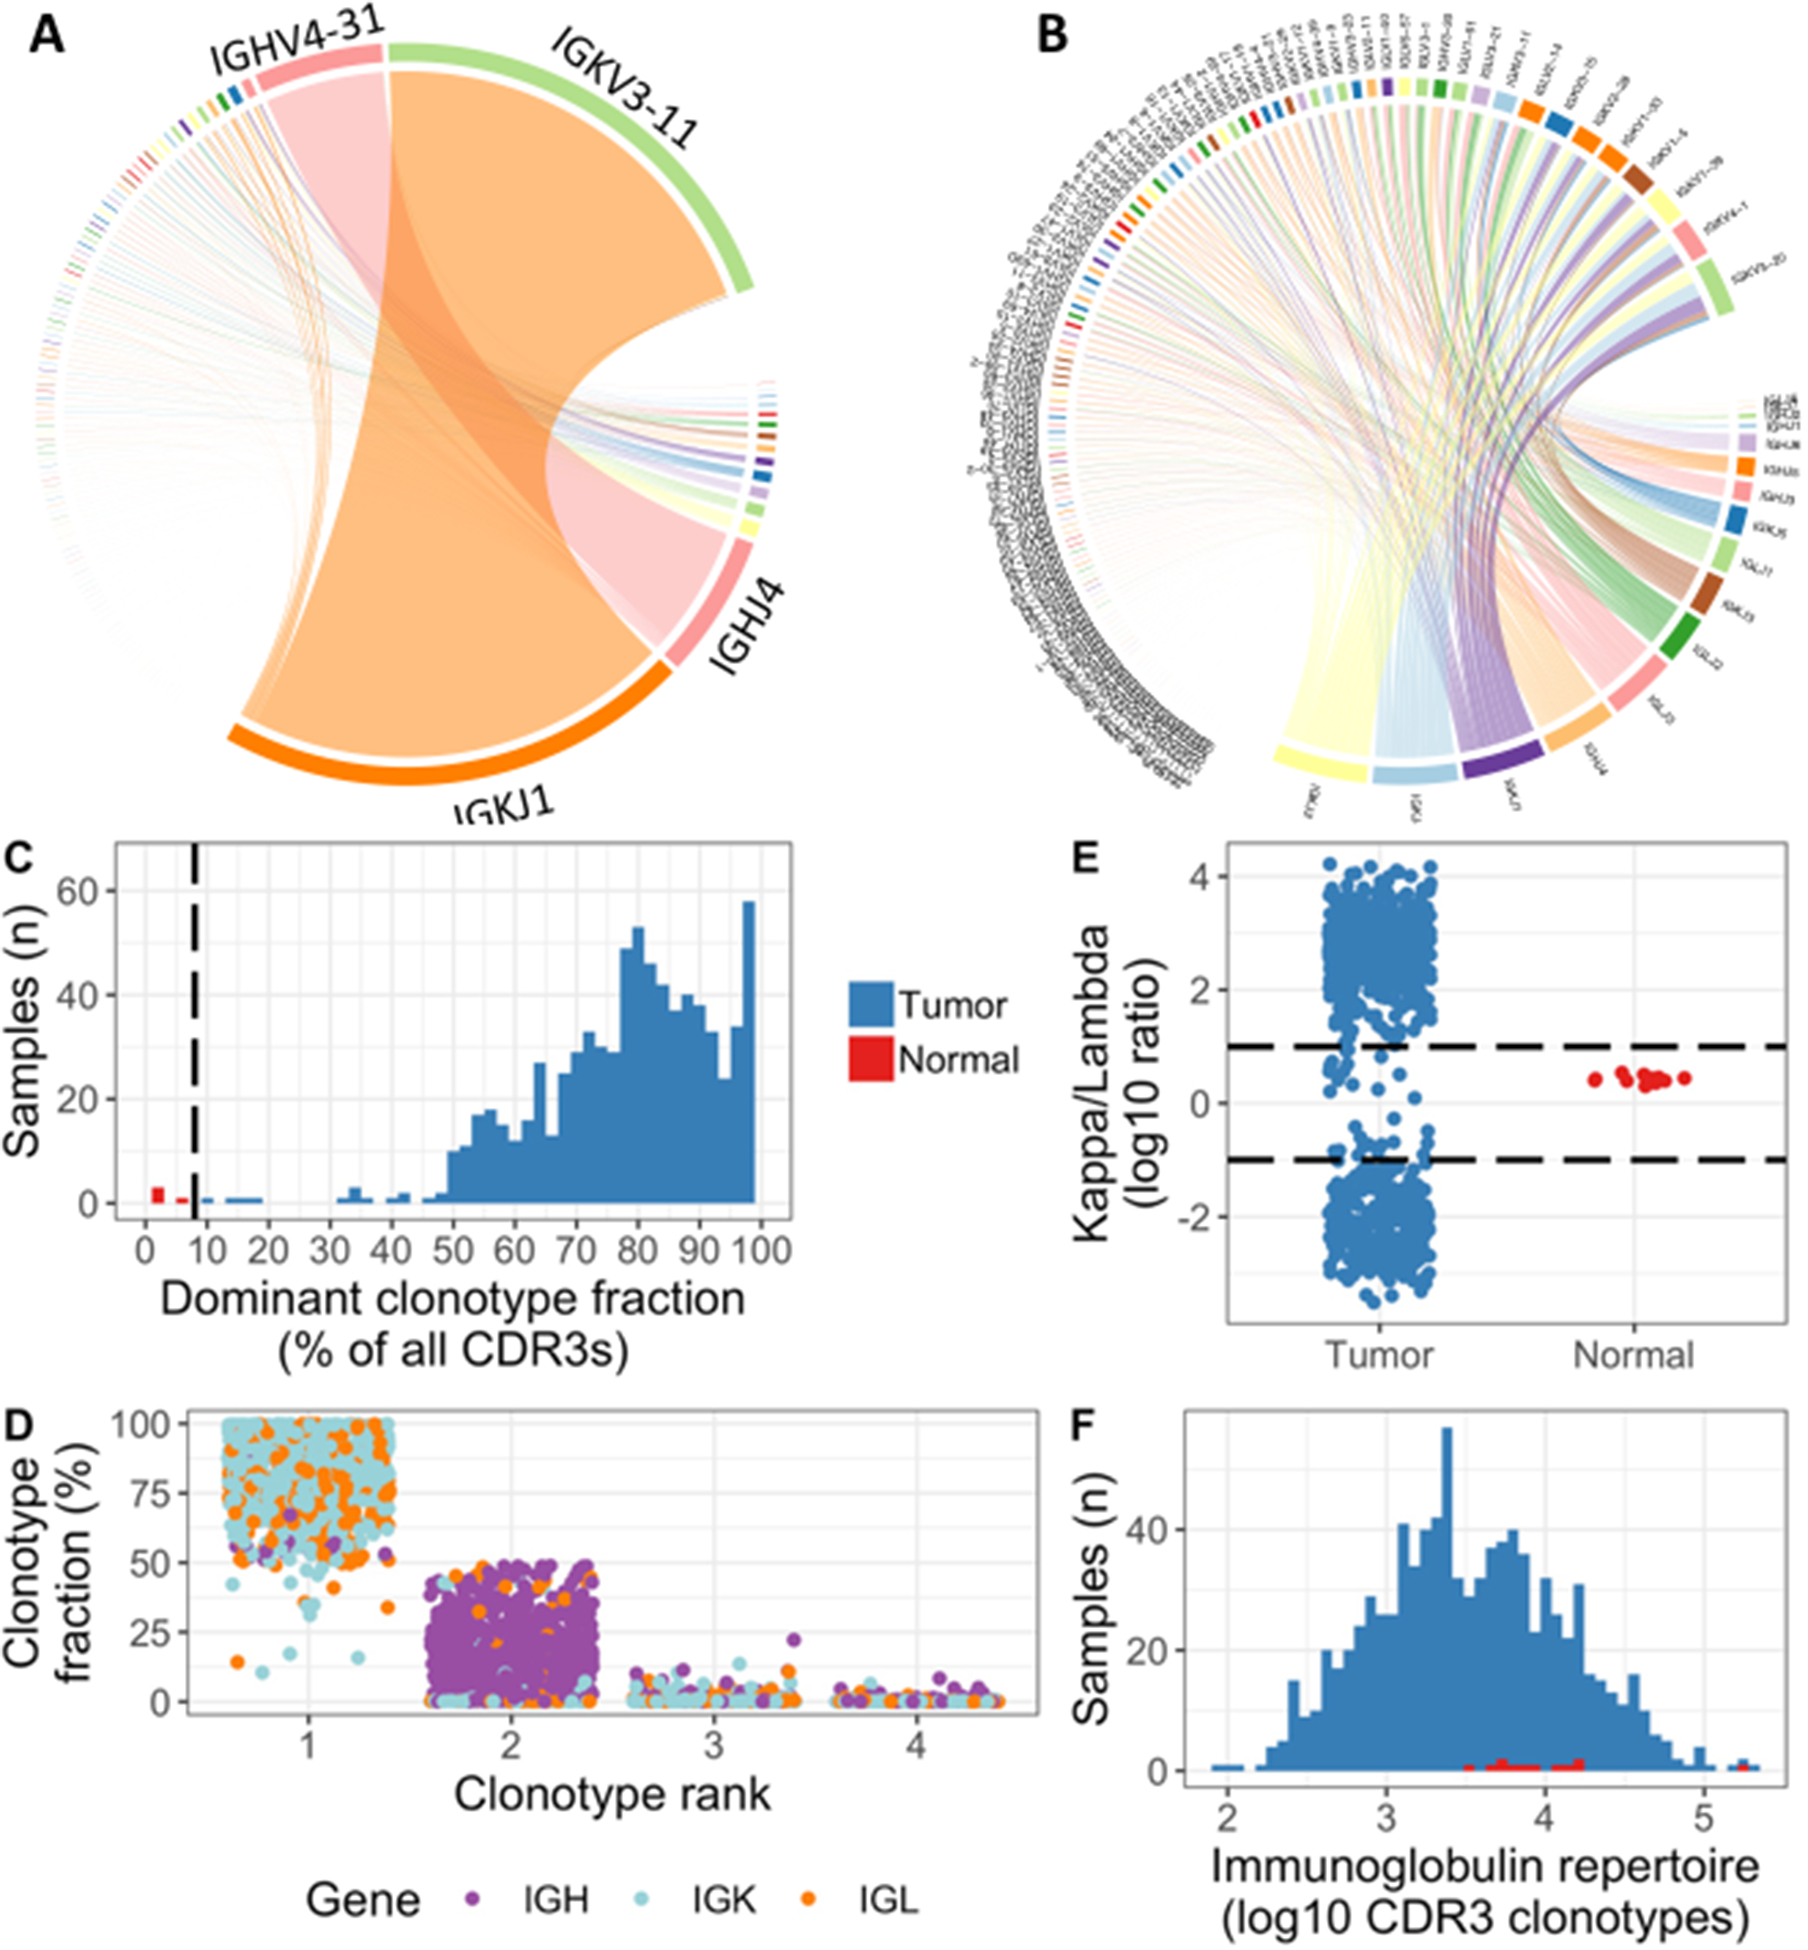
Clonotype dominance and skewed light chain repertoire in plasma cell tumors. A, Immunoglobulin repertoire in patient with multiple myeloma, highly dominated by clonal rearrangements of IGK (J1/V3–11) and IGH (J4/V4–31). Lines connect J gene segments in the lower right corner with V gene segments in the upper left, with thickness representing the proportion of immunoglobulin sequences with the respective V–J combination. B, Polyclonal immunoglobulin repertoire in CD138+ cells from normal bone marrow. C, Histogram showing the fraction of CDR3 reads made up by the dominant clonotype in each sample. The dotted line at 8% perfectly separates normals from tumors. D, The four most abundant clonotypes in each baseline sample, as percentage of total immunoglobulin CDR3 expression. The involved light chain was most commonly ranked 1st, with a heavy chain as 2nd. E, Ratio of total kappa to total lambda CDR3 expression plotted on a log10 scale, showing highly skewed repertoires in the vast majority of baseline tumor samples, whereas all the normal bone marrows are within a narrow window. F: Histogram showing the number of CDR3 clonotypes extracted from each tumor and normal sample on a log10 scale.
