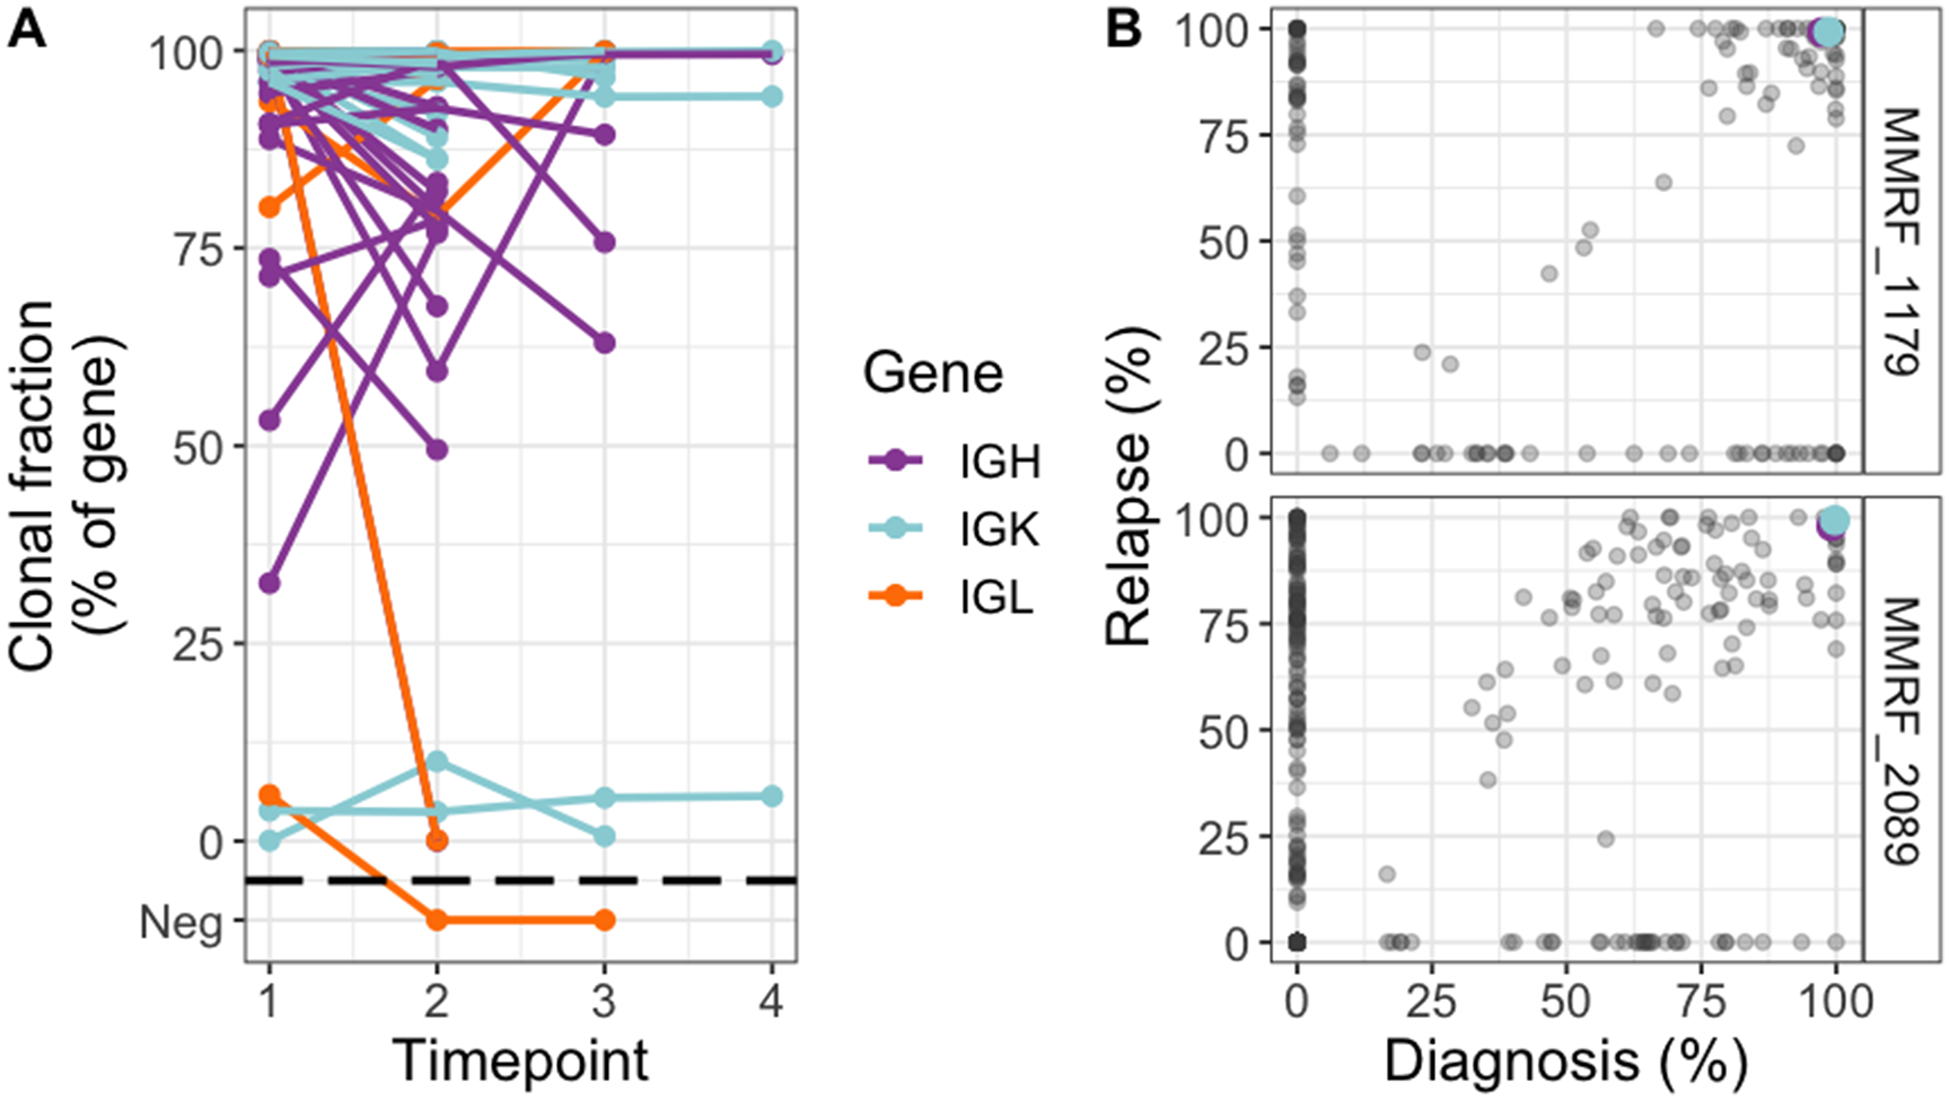
Figure 3.

Stability of clonal immunoglobulin CDR3 sequences despite changing clonal dominance by exome sequencing. A, Tracking of clonal CDR3 sequences over time in sequential samples from the CoMMpass dataset. Included in this analysis were all CDR3 sequences that fulfilled clonality criteria on one or more time-point. Changes in clonal fraction of a single clone without corresponding subclonal changes likely reflects changes in the polyclonal background rather than clonal evolution. B, Two example patients where the dominant subclone changed from diagnosis to relapse, while the clonal IGH and IGK CDR3 sequences remained identical. Colored points are CDR3 clonal fractions at diagnosis (x-axis) and relapse (y-axis), plotted on the same scale as in A (i.e. clonal CDR3 expression). Somatic mutations are plotted on the same axes (gray points), represented by its cancer cell fraction (variant allele fraction corrected by tumor purity and local copy number). Gray dots along the diagonals have similar cancer cell fraction at both time-points; with the upper right corner cluster representing shared clonal mutations. Mutations clustered in the lower right corner were present in subclones that dominated at baseline and became undetectable at relapse. Conversely, mutations plotted in the upper left corner represent an undetectable subclone at diagnosis which became dominant at relapse. Taken together this shows a shift in clonal dominance in these patients as defined by exome sequencing, while the dominant CDR3 sequences remained identical.
