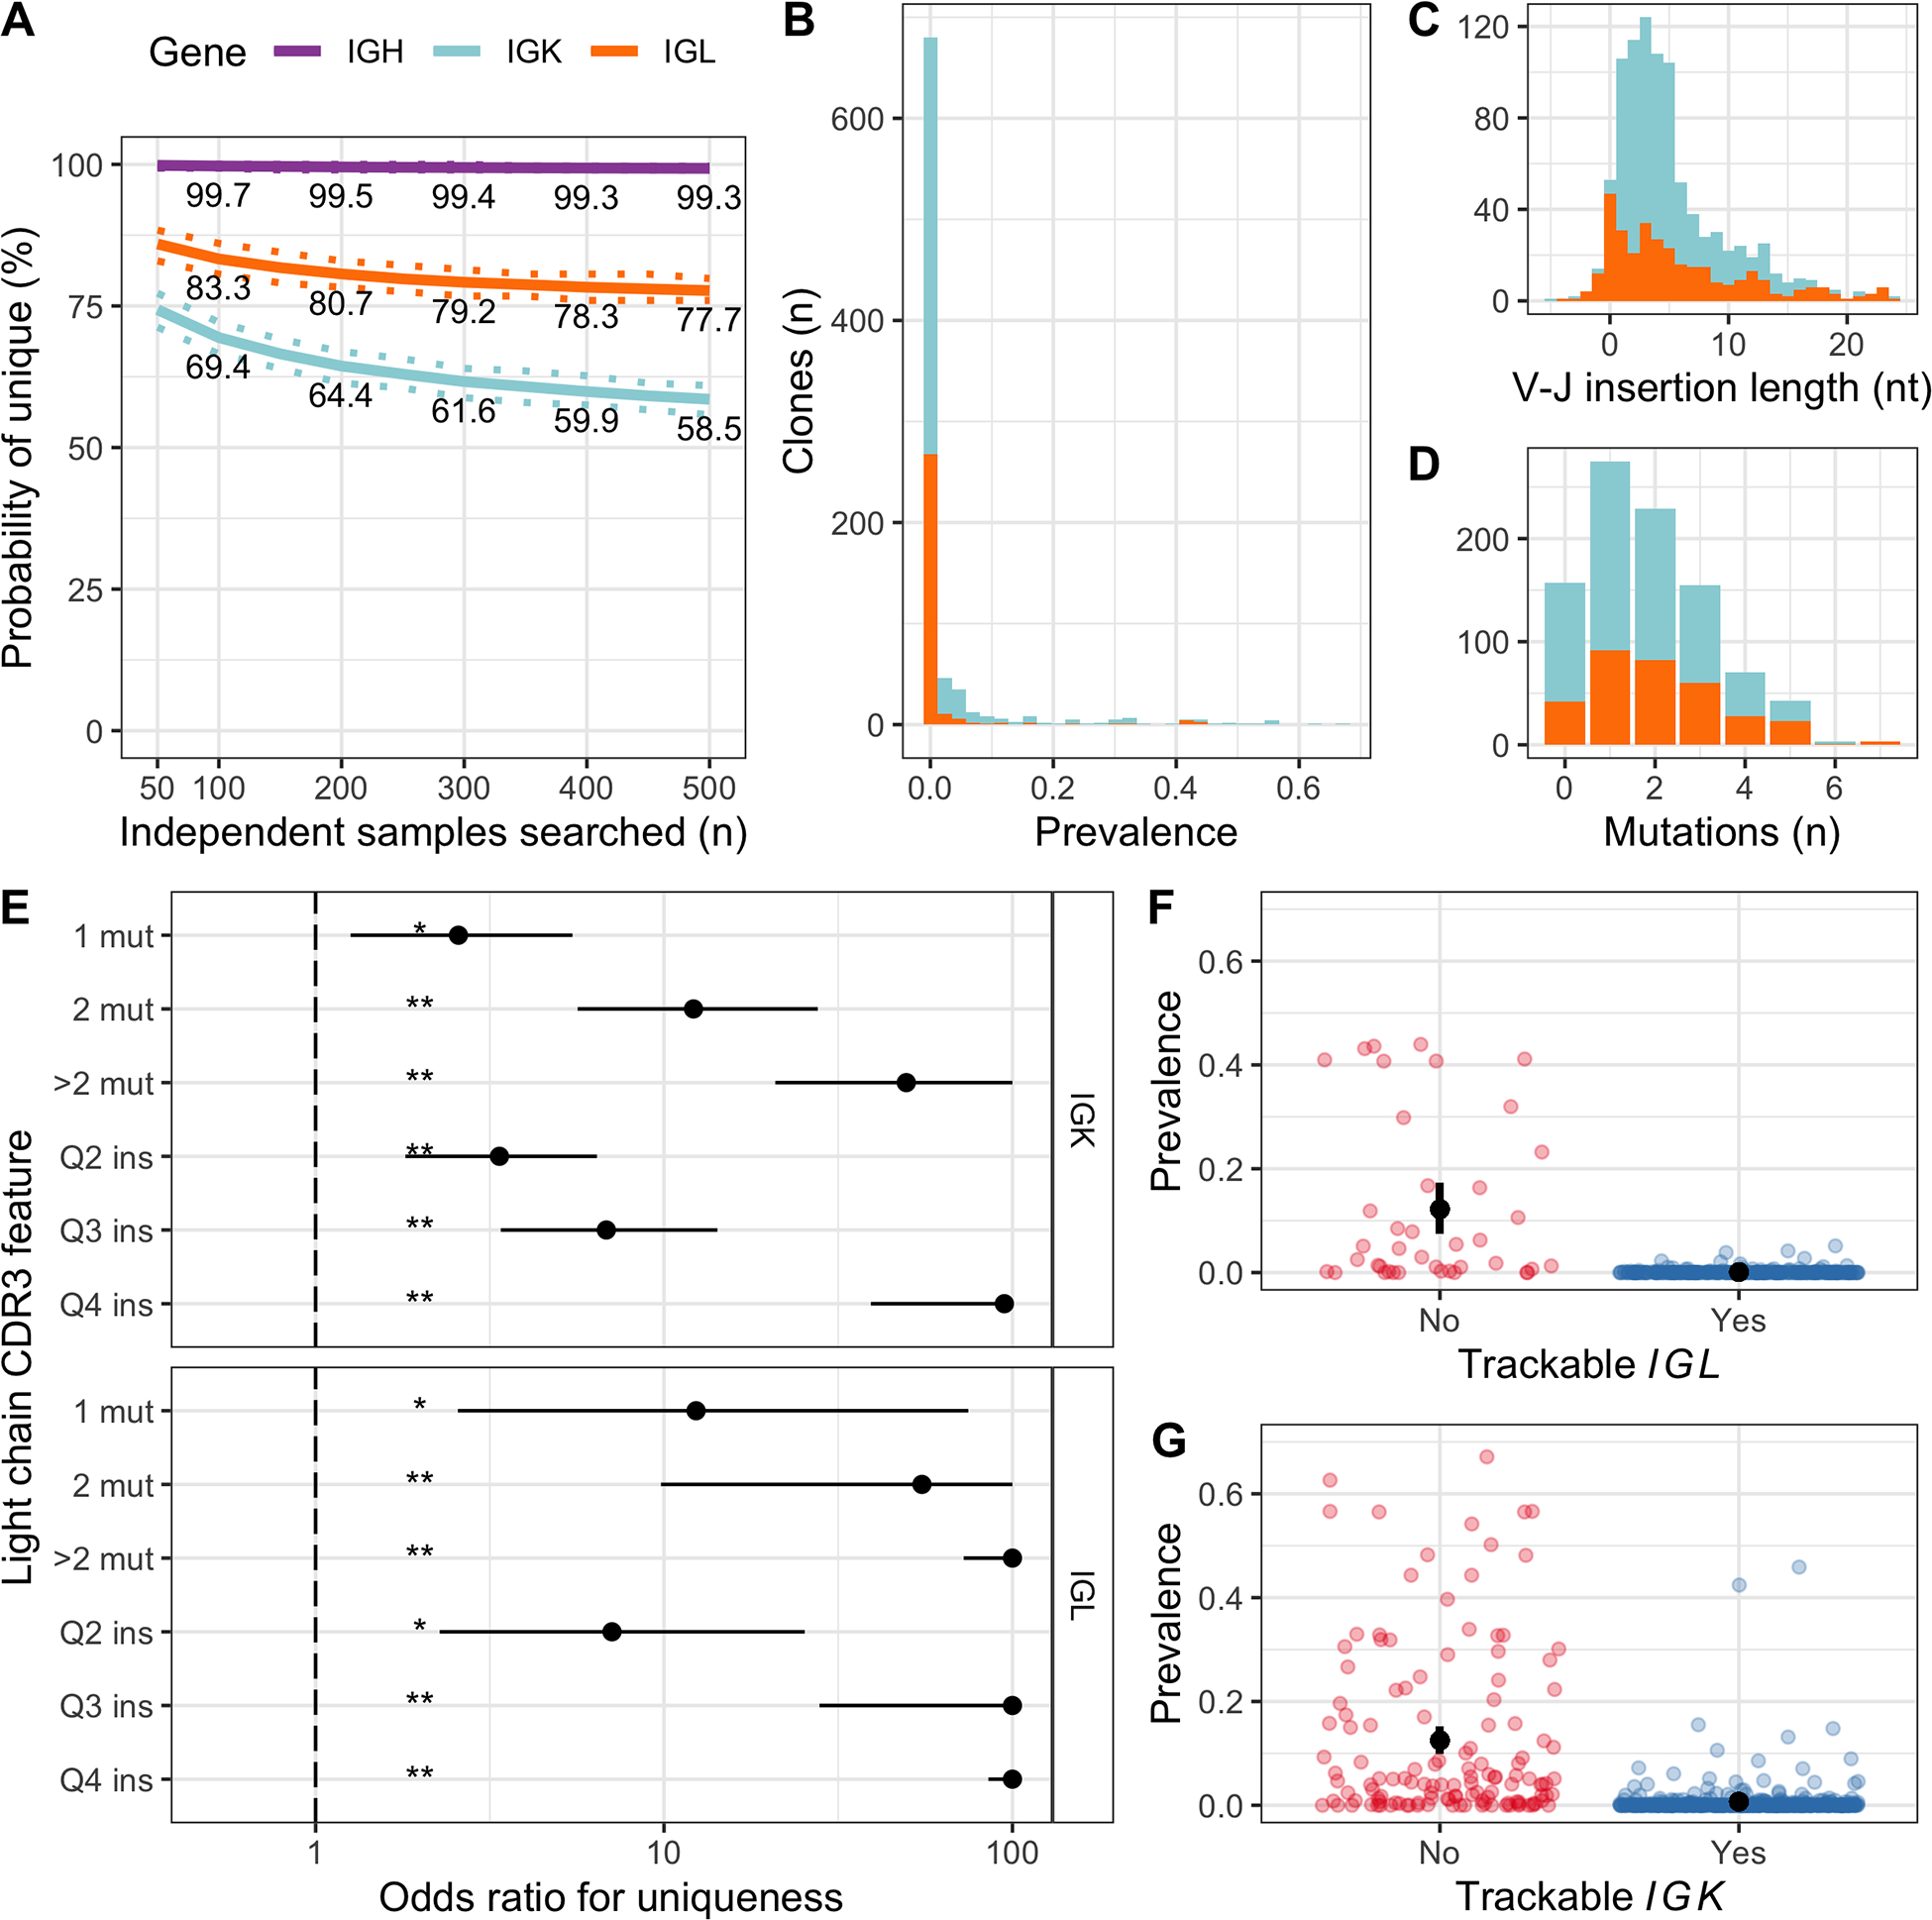
Figure 4.

Uniqueness of IGK and IGL CDR3 sequences was determined by somatic mutations and V–J insertion length. A, Estimated probability of a clonal CDR3 being unique after searching a given number of independent samples. Continuous and dashed lines represent bootstrapping mean and 95% confidence intervals, respectively. Clonal sequences with 500 or more independent samples available to search were included in this analysis: 307 IGH sequences, 233 IGK and 129 IGL. B, Prevalence of each clonal IGK (light blue) and IGL (orange) CDR3 sequence in the population of independent samples, shown as a stacked histogram. Sequence prevalence (x-axis) was calculated as the number of samples where the sequence was identified, divided by the total number of samples searched. C, Stacked bar chart showing the V–J insertion length distribution for clonal IGK and IGL sequences. The median length was 4 nucleotides for both genes. D, Similar to C, showing the number of somatic mutations in the CDR3. The median was 1 for IGK and 2 for IGL. E, Results from two independent multivariate logistic regression models for IGK and IGL, where each clonal CDR3 sequence was a case and the outcome was whether the clone was unique (i.e. not found in any samples). Odds ratios (points) above 1 indicate increased probability of the clonal sequence being unique compared to the reference level, 95% confidence intervals are represented by horizontal lines and statistical significance is indicated by asterisks (**P < 0.001, *P < 0.05). Values were limited to 100. Only results from somatic mutation number (mut) and V–J insertion length (ins) are shown here, however the model also included V and J gene usage and CDR3 length, and was adjusted for the number of independent samples available to determine uniqueness. F, Displaying the prevalence of each clonal IGL CDR3 in independent samples (points), separated into trackable (blue) versus non-trackable (red) according to our simple criteria (>median mutation number or insertion length). Because the prevalence distribution was highly skewed, we used a bootstrapping approach to estimate the average prevalence in each group with 95% confidence intervals (black points with error bars). G, Similar to F, for IGK.
