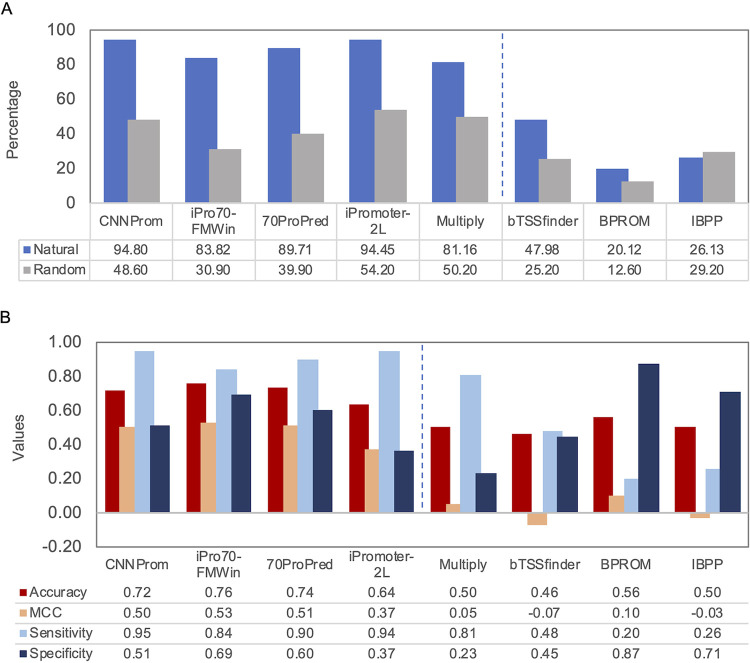
FIG 1.
Analysis of the performance of promoter prediction tools. (A) Percentage of sequences predicted as sigma 70-dependent promoters in both data sets. The percentage of correct classifications of experimental promoters (blue) and the percentage of misclassified random sequences (gray) are presented. The vertical dashed line separates the five best tools from the three worse tools analyzed. (B) Metrics used to evaluate the performance of the tools. Note that MCC values range from −1 to 1. It is important to emphasize that two tools presented the highest sensitivity associated with low specificity, i.e., tools usually perform good classifications for real promoters and high misclassification of random sequences. The vertical dashed line divides the four best tools from the four worse tools.

