
Figure 5.
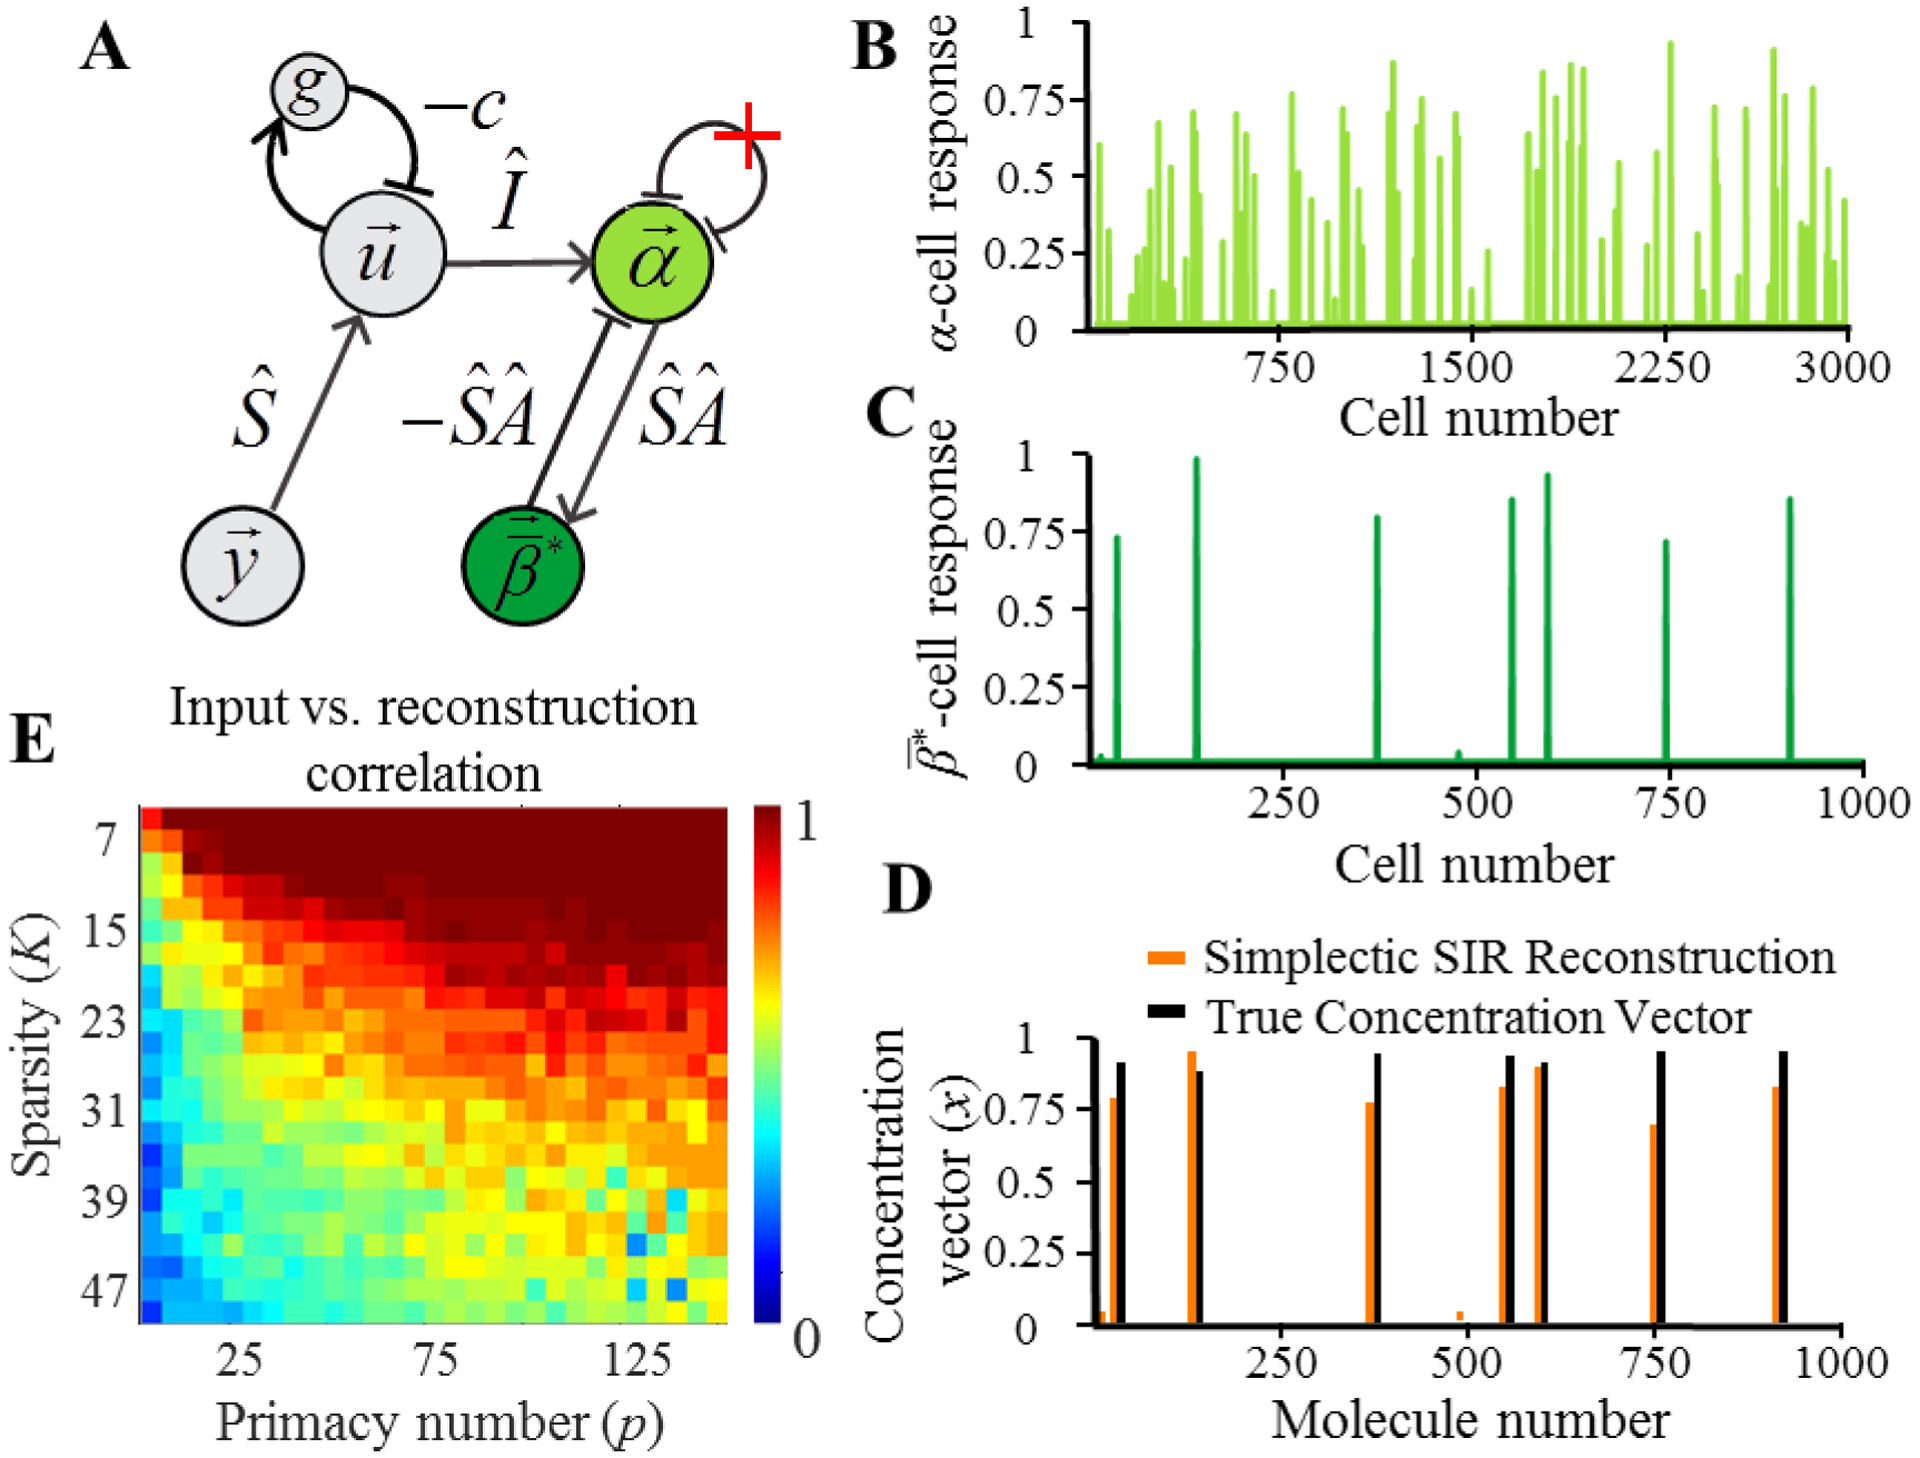
(A) The structure of the dual network implementing SIR model. α cells (light green) implement the dual representation of the concentration vector. cells (dark green) represent the reconstruction of the concentration vector. (B) Example firing rates of α cells. (C) Example of the sparse firing rates of cells. (D) Comparison of the simplicial SIR model’s reconstruction (orange) and the concentration vector. (E) Correlation between simplicial SIR model’s reconstruction of the concentration vector and the true concentration vector for a range of stimulus and network parameters, K and p.