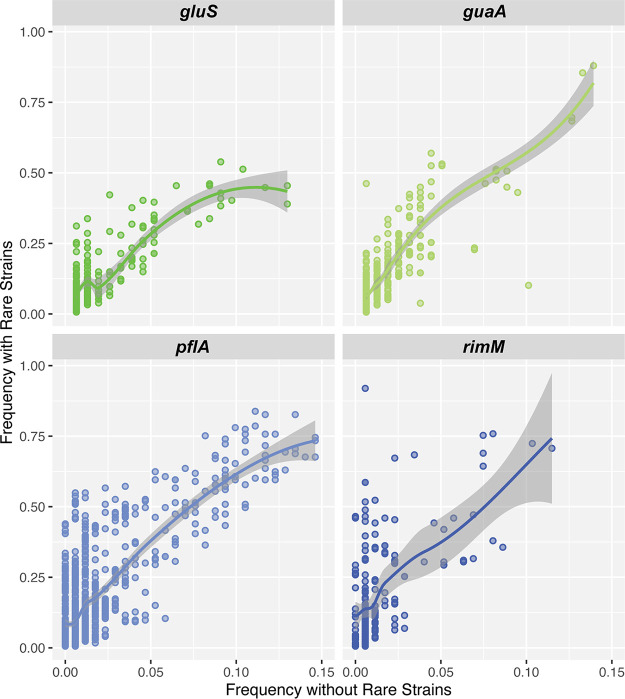
FIG 7.
Prevalence of rare strains across bees with relaxed filters. The x axis represents the prevalence of each strain in our sample of bees (percentage of bees where the strain has been identified). The y axis shows the prevalence of each strain when redefining the strains with relaxed filters: i.e., the strain is considered present even when found <1% frequency in the bee (see Materials and Methods).

