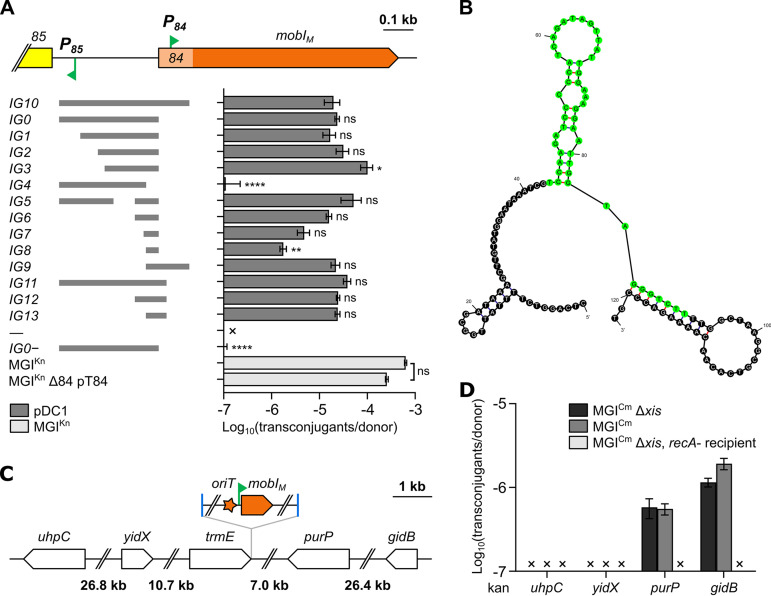
FIG 3.
Localization of the oriT locus of MGIVchHai6. (A) On the left, fragments of the 85-mobI region that were cloned into the nonmobilizable vector pDC1 are represented by gray bars. The resulting transfer frequencies for the corresponding fragments are presented on the right side. Mobilization assays of pDC1 derivatives were performed using E. coli GG56 (Nx) bearing pVCR94Sp and pT84 as the donor and VB112 (Rf) as the recipient. “—” indicates an empty pDC1. “IG0−” indicates that the transfer of pIG0 was assessed in the absence of pT84. Statistical analyses were carried out on the logarithm of the values using a one-way ANOVA followed by Dunnett’s multiple-comparison test with pIG10 or MGIKn as the control. Statistical significance is indicated as follows: ****, P < 0.0001; **, P < 0.01; *, P < 0.05; ns, not significant. (B) Predicted folding of IG12, with IG8 highlighted in green. Folding of the upper strand (panel A) was predicted using the Mfold web server (74). (C) Schematic map of the chromosomal region surrounding trmE in E. coli K-12. The position and orientation of MGICm are indicated. (D) MGICm-mediated mobilization of chromosomal markers from E. coli JW3642, JW3692, JW3718, or JW5858 (Kn) bearing pVCR94Sp and MGICm or its Δxis mutant to CAG18439 or its ΔrecA mutant (Tc). In panels A and D, the bars represent the means ± standard errors of the means from three independent experiments. “×” indicates that the transfer frequency was below the detection limit (<10−7).

