FIG 5.
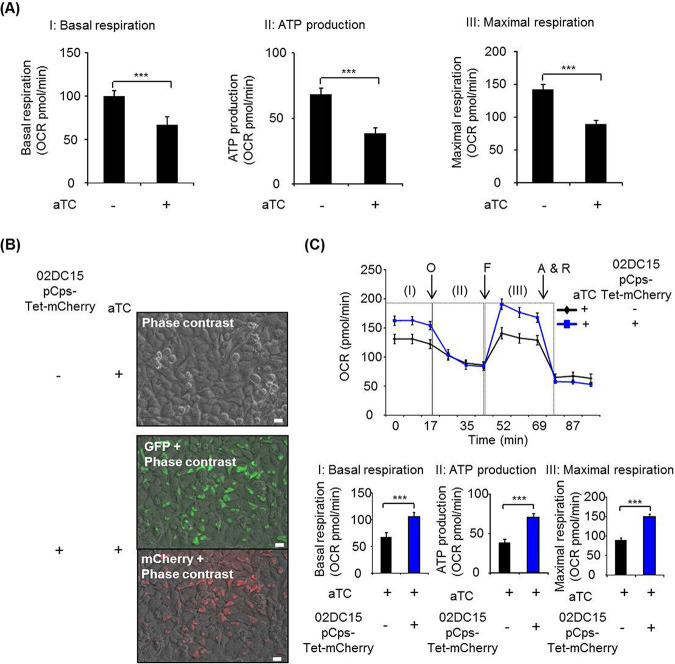
Analysis of mitochondrial activity in cells treated with aTC and infected with C. psittaci 02DC15-pCps-Tet-mCherry. (A) The effect of aTC (10 ng/ml) on mitochondrial activity in noninfected epithelial cells. Mitochondrial activity shown by oxygen consumption rate (OCR) was measured by a Mito Stress test kit at 24 hpi. I, II, and III indicate basal respiration, ATP production, and maximal respiration, respectively. (B) Phase contrast image of control cells and image overlay of phase contrast and GFP or mCherry in pCps-Tet-mCherry-transformed C. psittaci 02DC15-infected cells with 10 ng/ml of aTC. White scale bars represent 20 μm. (C) Mitochondrial activity in control cells and pCps-Tet-mCherry-transformed C. psittaci 02DC15-infected cells with 10 ng/ml aTC at 24 hpi. Arrows show sequential injection of different chemical compounds: O, oligomycin; F, FCCP; A & R, antimycin A plus rotenone. I, II, and III indicate basal respiration, ATP production, and maximal respiration, respectively. Images are representative of three independent experiments. (A: n = 13 from five independent experiments, C: n = 13 from five independent experiments; mean ± SEM, Student’s t test: ***, P ≤ 0.001).

