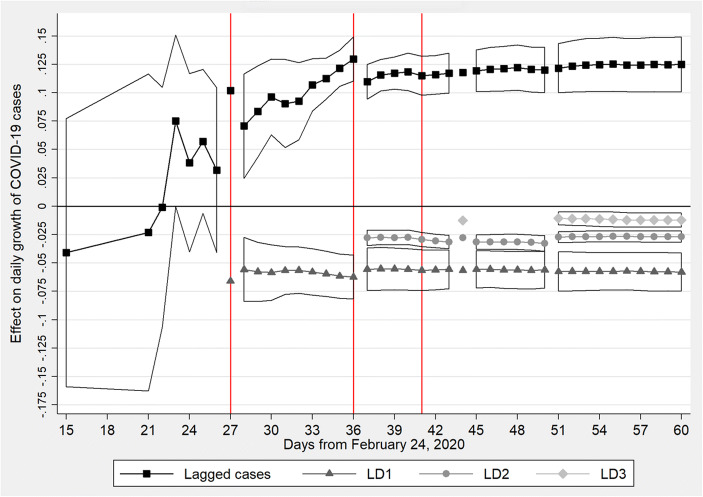
Fig. 5.
Effects of lockdowns on the daily growth of COVID-19 cases by time series length. Outlined areas represent confidence intervals at the 5% level. “Lagged cases” refers to the COVID-19 cases at time t-1, while “LD1,” “LD2,” and “LD3” stand for the three lockdown interaction terms in Table 1. The three vertical lines represent, respectively, the effectiveness days of the school lockdown, main lockdown, and business lockdown, as shown in Section 5

