. 2019 Aug 13;10(38):8880–8888. doi: 10.1039/c9sc03736e

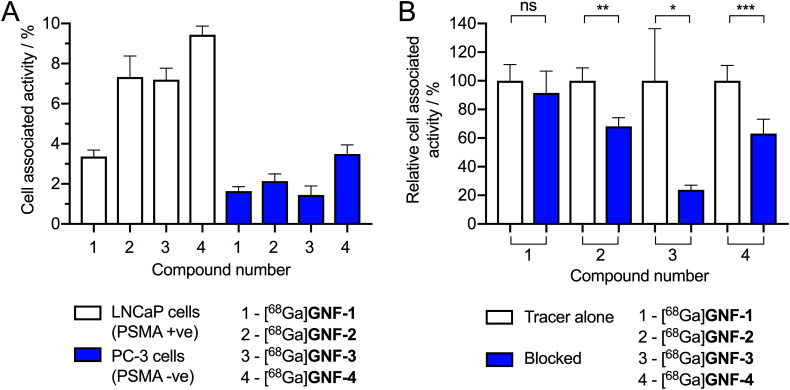
Fig. 7. (A) Cellular binding assay of [68Ga]GNF-1–4 with the LNCaP (PSMA +ve) and PC-3 (PSMA –ve) cell lines. Data given as the percentage of activity bound normalised per 1 mg mL–1 of total protein. All cell media contained 0.1% azide and protein content was measured using a BCA assay. For the LNCaP cell line: [68Ga]GNF-1vs. [68Ga]GNF-2, p ≤ 0.01; [68Ga]GNF-1vs. [68Ga]GNF-3p ≤ 0.001; [68Ga]GNF-1vs. [68Ga]GNF-4, p ≤ 0.0001. Comparison of cell lines: PC-3 vs. LNCaP [68Ga]GNF-2, p ≤ 0.01; [68Ga]GNF-3, p ≤ 0.001; and [68Ga]GNF-4, p ≤ 0.0001. (B) Blocking assay with the LNCaP (PSMA +ve) cell line pre-treated with free Glu-NH-C(O)-NH-Lys ligand (5 μM) before addition of radiotracers. Note: Student's t-test analysis: ns = not significant, * = P-value < 0.05, ** = P-value < 0.01, *** = P-value < 0.001.

Fig. 7