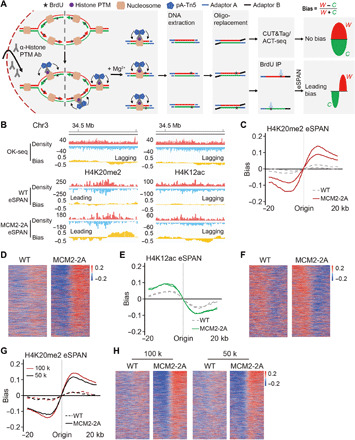
Fig. 1. Development of the eSPAN method to analyze proteins at replication forks in mammalian cells.

(A) A graphic diagram of the eSPAN workflow. Ab, antibody. (B) Snapshots of OK-seq reads density and bias and H4K20me2 and H4K12ac eSPAN reads density and bias in WT and MCM2-2A mouse ES cells at selected initiation zone regions on chromosome 3. Red and blue tracks indicate sequencing reads of Watson (W) and Crick (C) strands, respectively. Bias is calculated using the formula (W − C)/(W + C). (C and E) Average bias of H4K20me2 (C) and H4K12ac (E) eSPAN (n = 1548) in WT and MCM2-2A mouse ES cells with two repeats is shown for each genotype. (D and F) Representative heatmap of H4K20me2 (D) and H4K12ac (F) eSPAN biases in WT and MCM2-2A mouse ES cells at each of the 1548 initiation zones ranking from the most efficient (top) to the least efficient (bottom) ones based on OK-seq bias. (G) Average bias of H4K20me2 eSPAN (n = 1548) in 100 thousand (red) and 50 thousand (black) of WT and MCM-2A mouse ES cells. (H) Representative heatmap of H4K20me2 eSPAN biases in different amounts of WT and MCM2-2A mouse ES cells at each of the 1548 initiation zones ranking from the most efficient (top) to least efficient (bottom) ones.
