
Fig. 4. The Pol1 mutant defective in histone binding shows defects in parental histone transfer to lagging strand in budding yeast.
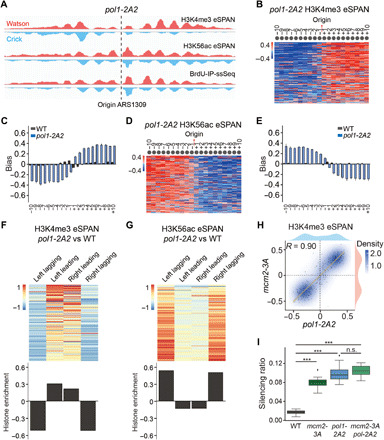
(A) Snapshot of BrdU-IP-ssSeq, H3K56ac, and H3K4me3 eSPAN peaks surrounding the ARS1309 origin in pol1-2A2 mutant cells. Red and blue tracks represent sequencing reads of Watson and Crick strands, respectively. (B and D) Heatmap representing the bias ratio and pattern of H3K4me3 (B) and H3K56ac (D) eSPAN peaks in pol1-2A2 mutant cells at each of the 20 individual nucleosomes surrounding each of the 134 early DNA replication origins ranked from top to bottom based on replication efficiency. Individual nucleosomes are represented by a circle, and their positions are indicated (−10 to +10), with each row representing one origin. (C and E) The average bias ratio of H3K4me3 (C) and H3K56ac (E) eSPAN peaks in WT and pol1-2A2 mutant cells at each of the 20 individual nucleosomes of the 134 early replication origins. Data were shown as means ± SEM from two independent replicates. (F and G) The relative amount of H3K4me3 (F) and H3K56ac (G) in pol1-2A2 compared to WT strains at each of the 134 origins (heatmap, top) and the average (bottom) of these origins. (H) H3K4me3 eSPAN bias patterns in pol1-2A2 showed a strong correlation with that of mcm2-3A. Spearman’s rank correlation coefficient and the density distribution were shown. (I) Effects of the pol1-2A2 and mcm2-3A mutation alone and in combination on the silencing loss at the HML locus. Data were plotted as means ± SEM from three independent repeats. ***P < 0.001; n.s., not significant; P > 0.05.