
Fig. 1. Exogenous and endogenous H2S induces mitochondrial uncoupling.
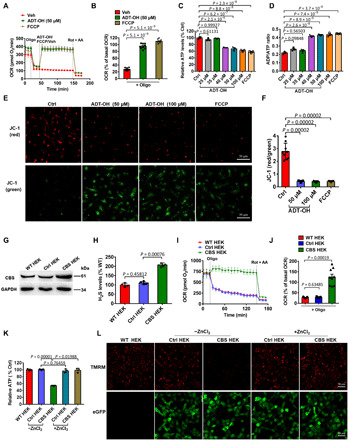
(A to F) Real-time change and statistical analysis of OCR (A and B; n = 9), ATP levels (C; n = 3), ADP/ATP ratios (D; n = 3), and ΔΨm (E, representative images of JC-1 staining; F, statistical analysis; n = 9) in primary microglia treated with the H2S donor ADT-OH or the protonophore uncoupler FCCP. For OCR assay, oligomycin (Oligo), rotenone (Rot), and antimycin A (AA) were added at the indicated time points. ATP/ADP and ΔΨm were assessed at 30 min after treatment with ADT-OH or FCCP. Control (Ctrl), vehicle (Veh)–treated cells. (G) Protein levels of the H2S synthase cystathionine β-synthase (CBS) in wild-type human embryonic kidney (HEK) 293 cells (WT HEK), control HEK293 cells stably expressing enhanced green fluorescent protein (eGFP) (Ctrl HEK), and recombinant HEK293 cells stably overexpressing CBS and eGFP (CBS HEK); three independent replicates. (H) Relative H2S levels in medium collected from WT HEK, Ctrl HEK, or CBS HEK cultures (n = 4). (I to K) Real-time change and statistical analysis of OCR (I and J; n = 9), and ATP levels (K; n = 3) in WT HEK, Ctrl HEK, and CBS HEK cells. ZnCl2 was added to block the effects of free H2S. (L) ΔΨm in WT HEK, Ctrl HEK, and CBS HEK cells with/without ZnCl2 (three independent replicates). Red, tetramethylrhodamine, methyl ester (TMRM) fluorescence; green, eGFP fluorescence. GAPDH, glyceraldehyde-3-phosphate dehydrogenase.