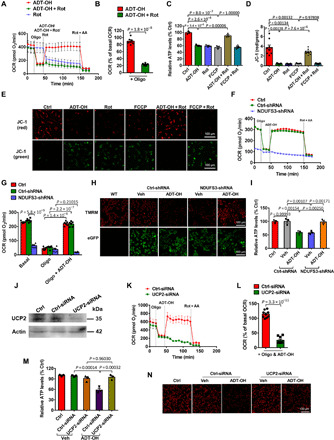
Fig. 4. H2S induces mitochondrial uncoupling via complex I RET and UCP2.

(A to E) The complex I RET inhibitor Rot abolished ADT-OH (50 μM)–induced mitochondrial uncoupling in primary microglia, as indicated by OCR (A, real-time change; B, statistical results; n = 6), ATP levels (C; n = 3), and ΔΨm (D, statistical results; n = 9; E, representative images of JC-1 staining). For OCR assay, the reagents were added, as indicated, except that Oligo was not added to the cells treated with Rot alone. Ctrl, Veh-treated cells. (F to I) Knockdown of the complex I subunit NDUFS3 abolished ADT-OH (50 μM)–induced mitochondrial uncoupling in HEK293 cells, as indicated by OCR (F, real-time change; G, statistical results; n = 6), ΔΨm (H, representative images of TMRM staining; green, eGFP fluorescence in NDUFS3-shRNA–infected or Ctrl-shRNA–infected HEK293 cells; three independent replicates), and ATP levels (I; n = 3). To indicate mitochondrial uncoupling, ATP levels and ΔΨm were assessed at 30 min after ADT-OH and/or Rot treatment. (J) UCP2 knockdown efficiency in BV2 microglia (three independent replicates). (K to N) Knockdown of UCP2-abolished ADT-OH (50 μM)–induced mitochondrial uncoupling in BV2 microglia, as indicated by OCR (K, real-time change; L, statistical results; n = 9), intracellular ATP levels (M; n = 3), and ΔΨm (N, representative images of TMRM staining; three independent replicates).
