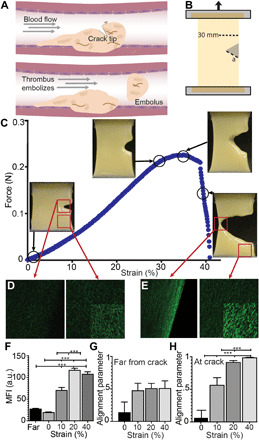
Fig. 1. Rupture of cracked fibrin gel specimens.

(A) Schematic of incipient rupture and embolization of an intravascular blood clot due to shear tractions of blood flow acting on its surface (dashed arrow), causing opening of a tensile crack. (B) Schematic of crack geometry showing a 30-mm-wide fibrin clot sample with an edge crack (a). (C) Crack propagation in a stretched plasma gel made with human blood plasma. Samples were stretched at 3 mm/min while recording force-displacement curves. (D and E) Representative fluorescence confocal microscopy images at the crack tip or far from the crack in the fibrin network that was unstrained (D) and stretched at 40% strain. (E) Images are all at the same gain and other microscope settings for comparison, showing the densification with stretching, except for the insets, where the brightness was increased to show fiber orientation. Fibrin gels were strained to 10, 20, and 40%. While still under tension, samples were immersed in fixative and then excised from the stretching device. (F) Fiber density, as measured by the mean fluorescence intensity (MFI), increased at the crack tip (<100 μm) with increasing strain (10 to 40%) and compared to areas removed from the crack tip (>1 mm). (G and H) Fibers showed increasing alignment (maximum order parameter = 1) under increasing strain at the crack tip, but not far from the crack. Statistical significance was determined by a one-way analysis of variance (ANOVA) followed by a Tukey multiple comparison test. ***P < 0.001. a.u., arbitrary unit.
