
Fig. 1. Tracking monocyte derivatives after neonatal stroke in CCR2RFP/+; CX3CR1GFP/+ (R/G) mice.
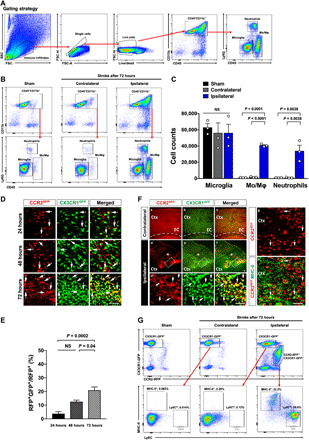
(A) The gating strategy for flow cytometry analysis used in (B). (B and C) Flow cytometry of the brain myeloid cells after photothrombosis in P16 mice. Shown in (B) are representative flow plots and in (C) are quantification results at 72 hours after stroke (n = 3 males). (D and E) Sections of the brains of R/G mice at 24, 48, and 72 hours after stroke (n = 6 to 15 of both genders). Arrows indicate CX3CR1GRP+CCR2RFP+ double-positive cells in the ipsilateral hemispheres in all time points. (F) At 72 hours after stroke, CCR2RFP+ monocytes (d and d′), CX3CR1GFP+ ameboid microglia (e and e′), and CX3CR1GRP+CCR2RFP+ cells (f and f′) were concentrated at the infarct border (asterisk) but absent in the contralateral hemisphere (a, b, and c). Many invading CCR2RFP+ monocytes expressed MHC-II (g and h) (n = 15 from both genders). (G) Flow cytometry of the R/G mouse brains at 72 hours after stroke. The CX3CR1GFP+ cells in the sham and contralateral hemisphere were negative for MHC-II and Ly6C. The CX3CR1GFP+CCR2RFP- cells in the ipsilateral hemisphere included few MHC-II+Ly6C− macrophages and MHC-II−Ly6C+ monocytes. In contrast, more CX3CR1GFP+CCR2RFP+ cells expressed the macrophage and monocyte markers. (n = 3 from 3 males for each). Data are presented as means ± SEM; analyses were performed using one-way ANOVA with Tukey’s post hoc test. Scale bars, 100 μm. Ctx, cerebral cortex; EC, entorhinal cortex; NS, not significant.