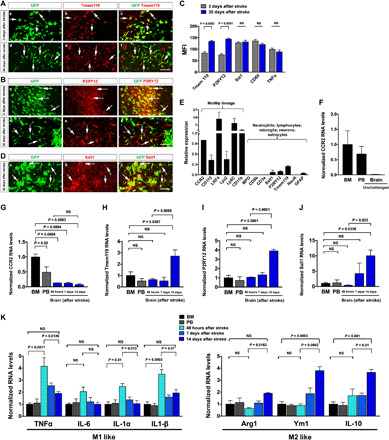
Fig. 6. Profiling the microglia and macrophage signature gene expression by monocyte derivatives in bitransgenic CCR2-CreER mouse brains.

(A and B) GFP+ monocyte derivatives showed ascending Tmem119 and P2RY12 expression from 3 to 30 days after stroke (five males and one female for 3 days; six males for 30 days). (C) Mean fluorescence intensity (MFI) on CCR2+ derivatives from (A) and (B) (n = 6). Data are shown as means ± SEM, and the P value was determined by Student’s t test. (D) Sall1 mRNAs were present in GFP+ monocyte derivatives at 30 days after neonatal stroke (n = 3 males). (E) TRAP analysis showed amplification of monocyte-specific transcripts in the BM of tamoxifen-induced adult CCR2-CreERtg/+; R26R-EGFP/Rpl10Atg/+ mice (n = 3 males). (F) TRAP analysis of CCR2 mRNA levels in BM, PB, and brain at P16 (n = 3 males). (G to J) TRAP-based qPCR analysis showed gradual decline of CCR2 mRNAs and an inverse increase in Sall1, P2RY12, and Tmem119 mRNAs in monocyte derivatives in tamoxifen-dosed mouse brains from 48 hours to 7 days to 14 days after stroke compared with monocytes in BM and PB. Dare are shown as means ± SEM (n = 3 males), one-way ANOVA with Tukey’s post hoc test. (K) TRAP analysis showed gradual decline of M1-like cytokine and an inverse increase in M2-like mRNAs in brain monocyte derivatives from 48 hours to 7 days to 14 days after stroke, compared with monocytes in BM and PB. Data are shown as means ± SEM (n = 3 males), one-way ANOVA with Tukey’s post hoc test. Scale bars, 100 μm.
