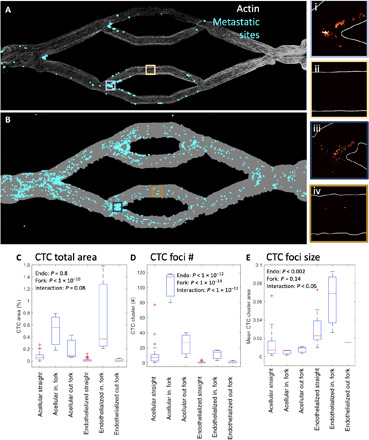
Fig. 5. Attachment sites of CTCs shows differences between acellular and endothelialized channels with differences at fork points.

(A) Full endothelialized vascular bed with identified CTC sites (cyan). In inset i, high attachment is seen in an incoming (in.) fork, whereas in inset ii, a straight channel shows no attachment. (B) Full acellular vascular bed exhibits greater CTC burden compared to endothelialized (4% of vessel area versus 2%). In inset iii, an incoming fork shows high CTC burden, but cells tend to be isolated, and no large clusters are observed; in inset iv, a straight region shows some CTC attachment. (C) CTC area is higher in incoming fork regions, with a significant interaction between endothelialization and geometric feature. out, outcoming. (D) Many more CTC foci are observed in the acellular geometry and in incoming forks with a significant interaction. (E) CTC foci size is highest in endothelialized geometries, with an interaction demonstrating larger average CTC cluster size in endothelialized incoming forks.
