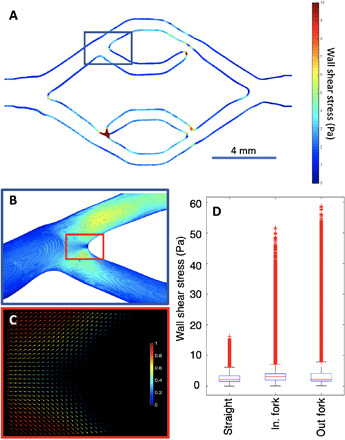
Fig. 6. WSS and laminar flow during CTC perfusion.

(A) WSS profile from the vessel sidewalls at center Z slice, gathered from simulation data generated with parameters matching those used for CTC perfusion experiments. Note that appearance of seemingly disconnected channel branches occurs because of Z height variation within the print, not true channel breaks. (B) Zoom in of the topmost vessel in-flow branching point, having the same heatmap as in (A), presenting the WSS present at both the sidewalls and vessel floor. (C) 2D quiver plot of topmost branching point velocity field simulates from the CTC perfusion experiment using scaled magnitudes, with 1 being the maximum flow velocity, demonstrating laminar, nonturbulent flow at the branching point at flow (1690 μl/min). (D) Whisker plot showing the WSS comparison between the straight vessels, in-flow branches, and out-flow branches, within the endothelialized device showing similar median values, with high-peak outliers present in the branching regions gathered from 13 × 106 total data points originating from HARVEY simulation.
